Figures & data
Figure 1. Chemical structure of daunomycin (A) and its Arg6 conjugate (B).
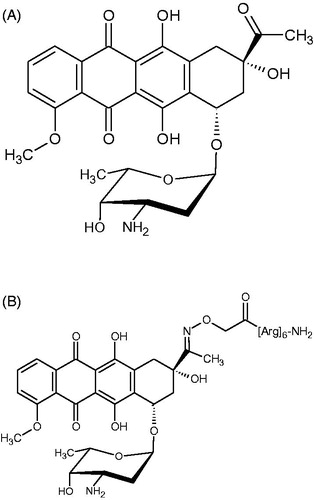
Figure 2. Topoisomerase assay. (A) Left panel: schematic representation of gel migration of the topoisomers (plasmid molecules with different supercoiling degree) from negative supercoiled (-10) to relaxed form (0). Right panel: the gel shows plasmid relaxation catalysed by h-TopoIIα: DNA Plasmid was incubated without (lane 1) or with (lanes 2–5) increasing concentrations of h-TopoIIα. (B) Inhibition of plasmid relaxation by Dau and Dau-Arg6: the left panel shows h-TopoII activity in absence (lane 1) and in presence of decreasing concentrations of Dau (lanes 3–5) or Dau-Arg6 (lanes 7–10); lane 1: plasmid alone. Right panel shows the Quantification of h-TopoII inhibition as a function of drugs concentration. The relative intensity of each band in the gel was measured and used to calculate the amount of total DNA (the unprocessed DNA plus the distinct topoisomer species), and that of all individual reaction products. For each condition, the inhibition of topoisomerase activity is expressed as a percentage of the produced topoisomers over the total DNA in each lane. Error bars represent standard deviations of three independent assays. (C) Inhibition of plasmid relaxation by Dau and Dau-Arg6: the left panel shows h-TopoI activity in absence (lane 1) and in presence of decreasing concentrations of Dau (lanes 3–5) or Dau-Arg6 (lanes 7–10); lane 1: plasmid alone. Right panel shows the quantification of h-TopoI inhibition as a function of drugs concentration. The inhibition was determined as described in (B).
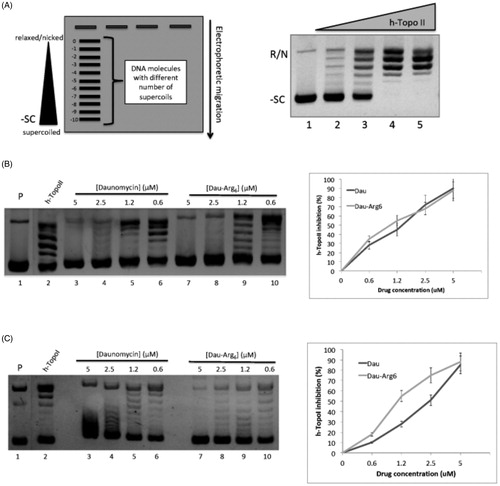
Figure 3. (A) Emission spectra of Dau and Dau-Arg6 derivative. (B) Effect of DNA plasmid on Fluorescence emission. (C) The chart shows the percentage of fluorescence quenching in function of plasmid concentrations.
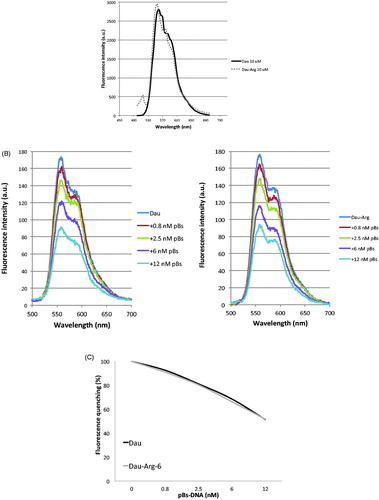
Figure 4. Melting analysis. Thermal denaturation of ctDNA (0.2 mg/mL) at λ = 260 nm in the absence and the presence of 4 µM Dau and Dau-Arg6 in Tris–HCl buffer. The melting temperatures (Tm) were determined as described in Section 2 and reported in the inset.
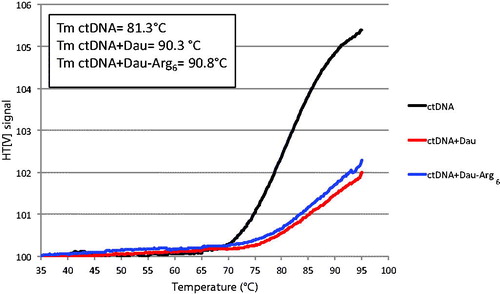
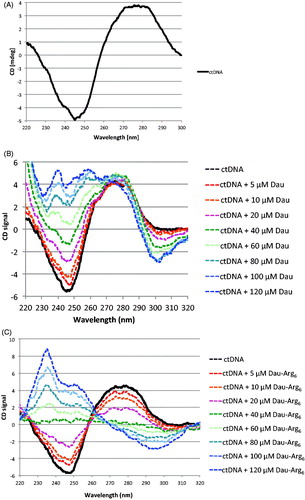
Figure 5. A. Circular dichroism analysis of Ct-DNA. (B) Circular dichroism analysis of ctDNA shows a typical features of B-DNA: a positive band at λ = 275 nm due to the base stacking and a negative band at λ = 245 nm specific of DNA helicity. (C) CD spectra of ctDNA in presence of increasing concentrations of Dau and Dau-Arg6 showing the changes in CD signals of B-DNA, after drugs binding.