
Figures & data
Figure 1. Trypanothione synthetase inhibitors. The structure and biological activities (IC50 against TryS or Ki, EC50 against trypanosomatids and selectivity index) are shown for representatives singletons or scaffolds reported to inhibit TryS. The data shown in the upper box were reported inCitation14 for phosphinopeptides, inCitation19 for oxabicyclo nonanone, inCitation15 for conessine, and inCitation16 for cynaropicrin. Data shown in the middle box was reported inCitation17 for the phenyl-indazole derivative and inCitation18 for the phenyl-tetrazole and -thiazole derivatives. Lower panel, the 7,12-dihydroindolo[3,2-d][1]benzazepin-6(5H)-ones core scaffold, referred as paullone, is shown in red. Incorporation of a Cl and Br atom at position 3 and 9, respectively, give rise to chlorokenpaullone. The asterisk denotes data reported in this work whereas information for FS-554 {9-trifluoromethylpaullone with N-[2-(methylamino)ethyl]acetamide side chain} and MOL2008 {3-chlorokenpaullone with N-[2-(methylamino)ethyl]acetamide side chain} was reported elsewhereCitation10,Citation20. Compound 20 is a 3-chlorokenpaullone with 2-oxo-2-piperazinoethyl side chain as hydrochloride.
![Figure 1. Trypanothione synthetase inhibitors. The structure and biological activities (IC50 against TryS or Ki, EC50 against trypanosomatids and selectivity index) are shown for representatives singletons or scaffolds reported to inhibit TryS. The data shown in the upper box were reported inCitation14 for phosphinopeptides, inCitation19 for oxabicyclo nonanone, inCitation15 for conessine, and inCitation16 for cynaropicrin. Data shown in the middle box was reported inCitation17 for the phenyl-indazole derivative and inCitation18 for the phenyl-tetrazole and -thiazole derivatives. Lower panel, the 7,12-dihydroindolo[3,2-d][1]benzazepin-6(5H)-ones core scaffold, referred as paullone, is shown in red. Incorporation of a Cl and Br atom at position 3 and 9, respectively, give rise to chlorokenpaullone. The asterisk denotes data reported in this work whereas information for FS-554 {9-trifluoromethylpaullone with N-[2-(methylamino)ethyl]acetamide side chain} and MOL2008 {3-chlorokenpaullone with N-[2-(methylamino)ethyl]acetamide side chain} was reported elsewhereCitation10,Citation20. Compound 20 is a 3-chlorokenpaullone with 2-oxo-2-piperazinoethyl side chain as hydrochloride.](/cms/asset/1b403c68-673c-4062-8d62-0e171ff3c443/ienz_a_1780227_f0001_c.jpg)
Table 1. Inhibition of trypanothione synthetase (TryS) by N5-substituted, 3-chlorokenpaullones.
Figure 2. Mode of Leishmania infantum TryS (LiTryS) inhibition by MOL2008. Lineweaver–Burk reciprocal plots for the LiTryS activity measured at different inhibitor (black square: 0 µM, red circle: 0.15 µM, blue triangle: 0.375 µM, violet star: 0.75 µM, green inverted triangle: 1.12 µM and magenta inclined triangle: 1.5 µM) and varying substrate concentrations while maintaining fixed the concentration of the co-substrates (13 mM for SP, 200 μM for ATP and 100 μM GSH). The enzyme velocities were measured using an end-point assay (see the section Materials and methods for details) and the reciprocal plots are shown for the varying substrate: (A) GSH, (B) ATP, (C) SP and (D) GSP [mono(glutathionyl)spermidine].
![Figure 2. Mode of Leishmania infantum TryS (LiTryS) inhibition by MOL2008. Lineweaver–Burk reciprocal plots for the LiTryS activity measured at different inhibitor (black square: 0 µM, red circle: 0.15 µM, blue triangle: 0.375 µM, violet star: 0.75 µM, green inverted triangle: 1.12 µM and magenta inclined triangle: 1.5 µM) and varying substrate concentrations while maintaining fixed the concentration of the co-substrates (13 mM for SP, 200 μM for ATP and 100 μM GSH). The enzyme velocities were measured using an end-point assay (see the section Materials and methods for details) and the reciprocal plots are shown for the varying substrate: (A) GSH, (B) ATP, (C) SP and (D) GSP [mono(glutathionyl)spermidine].](/cms/asset/6900522f-0349-4a80-b1f4-0174539db527/ienz_a_1780227_f0002_c.jpg)
Figure 3. Isothermal titration calorimetry of Leishmania infantum TryS (LiTryS) with MOL2008. Top plots: baseline subtracted thermogram showing differential heating power (DP) versus time. Bottom Plots: integrated and normalised heats of injections versus molar ratio fitted to a heterodimer association model with the corresponding residuals plots. (A) LiTryS (429 μM) versus MOL2008 (60 μM; non-competent fraction of compound = 0.218). (B) LiTryS (615 μM), glutathione (GSH, 2 mM), DTT (5 mM) versus MOL2008 (60 μM; non-competent fraction of compound = 0.329). (C) MOL2008 (60 μM) versus LiTryS (6.7 μM; non-competent fraction of enzyme = 0.459), ADP (2 mM). (D) MOL2008 (60 μM) versus LiTryS (6.2 μM; non-competent fraction of enzyme = 0.386), ADP (2 mM), GSH (2 mM) and DTT (5 mM).
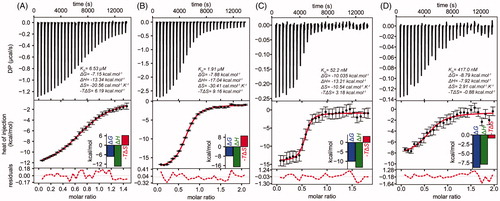
Figure 4. Molecular modelling and docking of selected compounds. (A) Cartoon representation of Leishmania major Trypanothione synthetase (LmTryS) bound to ADP (top), GSH (right) and GSP (left). The green shading represents the volume occupied by the ligands. Three different possible conformations of the loop248-263 (not solved in the X-ray structure of LmTryS , PDB id: 2VPS) were modeled and are represented by yellow, cyan and red ribbons. (B) Superimposition of the docking solutions for compounds 1, 20 and MOL2008 on the structure of EcGspS (PDB id: 2IOA). The volume of the ligands ADP and a phosphinate inhibitor solved in the X-ray structure are shown in green. These ligands were removed prior to docking calculations. Spheres represent the position of the N5 nitrogen in each docking pose. The binding affinities are indicated by colour from red to blue as percentage of the absolute best docking solution. (C) Top: superimposition of the docking solutions for the three paullones on the X-ray structure of LmTryS. Docking solutions are coloured as in B. The docking was performed in absence of the loop248-263. (D) and (E) Inset of the best docking solutions for MOL2008 and 20, respectively. Hydrogen bonds are depicted in green dashed lines and π-stacking interactions are represented with a translucent red surface. (F) Multiple sequence analysis of the segment corresponding to loop248-263 in TryS from different trypanosomatids coloured by conservation (black and grey background denote aminoacid conservation and homology, respectively, in at least 4 out 5 sequences). From the top to the bottom: TryS from L. major (LmTryS), L. infantum (LiTryS), Crithidia fasciculata (CfTryS), Trypanosoma cruzi (TcTryS) and Trypanosoma brucei (TbTryS).
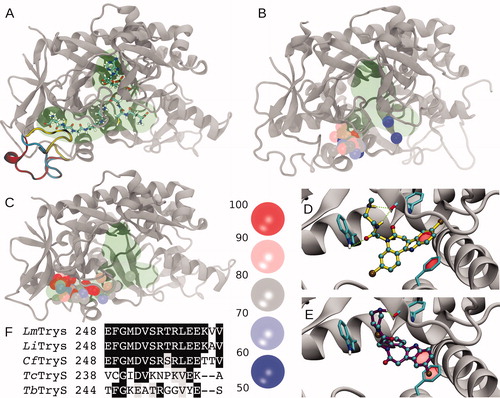
Table 2. Biological activity of N5-substituted, 3-chlorokenpaullones.
Figure 5. On-target effect of compound 20 in promastigotes and amastigotes of Leishmania infantum. (A) L. infantum promastigotes from the wildtype (WT) or TryS single knockout (sKO) cell line were incubated for 24 h in the absence (white bars) or presence of 7 µM 20 (black bars). The content of free glutathione (GSH) and trypanothione [T(SH)2] is expressed as % relative to samples from non-treated WT parasites. * and **, denote p values < 0.025 and = 0.0052, respectively (two-tailed t-test). (B) Murine macrophages (cell line J774) infected with L. infantum amastigotes from the WT and sKO cell lines were incubated for 24 h in the absence (white bars) or presence of 1 µM 20 (black bars). The results are expressed as relative fold-change in GSH and T(SH)2 content with respect to the corresponding non-treated control from each sample. ***, denotes a p values ≤ 0.001 (two-tailed t-test).
![Figure 5. On-target effect of compound 20 in promastigotes and amastigotes of Leishmania infantum. (A) L. infantum promastigotes from the wildtype (WT) or TryS single knockout (sKO) cell line were incubated for 24 h in the absence (white bars) or presence of 7 µM 20 (black bars). The content of free glutathione (GSH) and trypanothione [T(SH)2] is expressed as % relative to samples from non-treated WT parasites. * and **, denote p values < 0.025 and = 0.0052, respectively (two-tailed t-test). (B) Murine macrophages (cell line J774) infected with L. infantum amastigotes from the WT and sKO cell lines were incubated for 24 h in the absence (white bars) or presence of 1 µM 20 (black bars). The results are expressed as relative fold-change in GSH and T(SH)2 content with respect to the corresponding non-treated control from each sample. ***, denotes a p values ≤ 0.001 (two-tailed t-test).](/cms/asset/6721465b-51f9-4300-8ce7-1701514d1e3c/ienz_a_1780227_f0005_b.jpg)