
Figures & data
Figure 1. Synthesis of compounds 1–61.
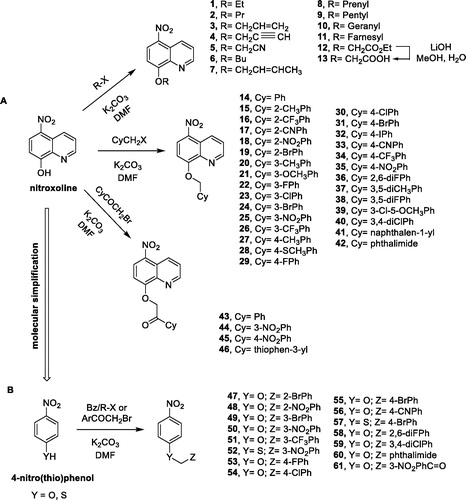
Figure 2. Crystal structure of nitroxoline-based compound 16.
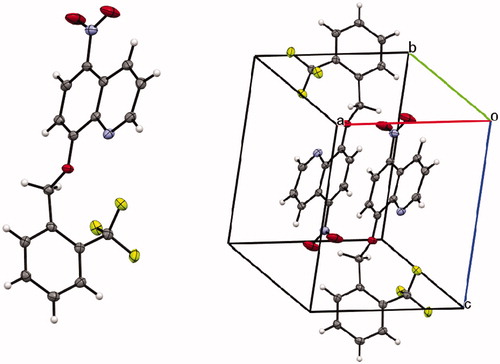
Figure 3. Screening of novel nitroxoline derivatives (1–61) on PC cell viability. Effects of novel derivatives on the viability of AsPC-1 (A), Capan-2 (B) and BxPC-3 (C) PC cell lines were assessed by MTT assays. The lead compound nitroxoline was included as a reference. MTT assays were performed by using compounds at 40 μM for 48 h and the histograms show the relative decrease of cell viability induced by treatments, as compared to nitroxoline. Data shown are the means ± SD of duplicate MTT experiments, each with quintuplicate determinations and are calculated as ratio relative to the lead compound nitroxoline (identified by a dashed line).
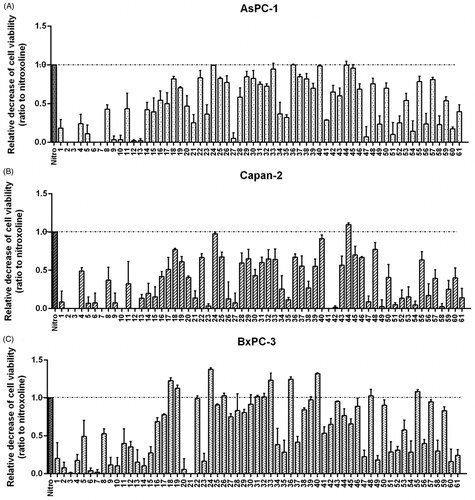
Table 1. IC50 values for compounds 24, 33, 36, 40, 44 and nitroxoline in PC cell lines.
Figure 4. Effect of compounds 33, 40 and nitroxoline on the clonogenic capacity of AsPC-1, Capan-2 and BxPC-3 PC cell lines. Representative plates of colony formation assays for the three PC cell lines exposed to tested compounds at 1 μM, 5 μM, or vehicle (control) are shown. Data shown in the histograms are the means ± SD of two independent experiments and are expressed as fold change relative to control (*p < 0.05; **p < 0.01; ***p < 0.001; ****p < 0.0001).
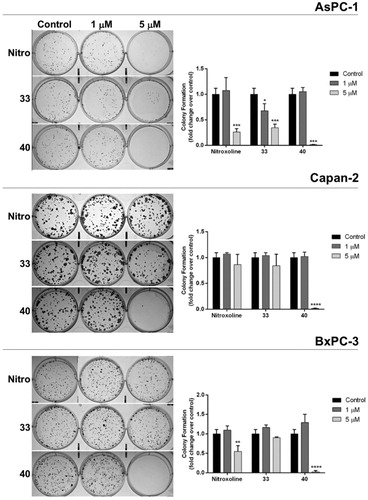
Table 2. Selectivity index (SI) values for compound 40 and nitroxoline.
Table 3. In silico evaluated physicochemical properties of nitroxoline and the most potent compounds 24, 33, 36, 40, and 44.
Figure 5. Representation of the boiled-egg graph and bioavailability radar calculated by SwissADME web-tool.
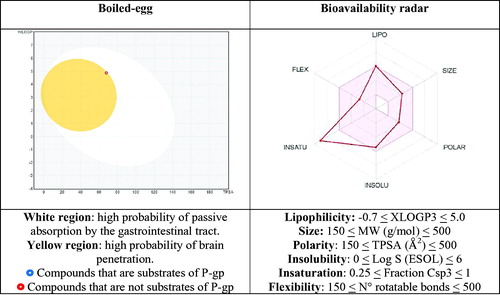
Table 4. In silico estimated physicochemical parameters of compound 40, used to device the boiled-egg graph and bioavailability radar.
Table 5. Protein target prediction for nitroxoline.
Table 6. Protein target prediction for compound 40.