Figures & data
Figure 1. Schematic representation of (A) CAs containing only of the catalytic domain, (B) CA IV, (C) CA IX and (D) transmembrane isoforms CA XII and CA XIV.
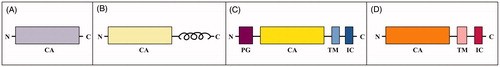
Figure 2. Sequence alignment of various human CA isoforms. Underlined are the signal peptide portions. In bold are reported identical residues at the same position present in at least seven isoforms. With asterisk are reported identical residues at the same position present in all isoforms. With colon are reported residues at the same position showing a high homology in CA isoforms. With dot are reported residues at the same position showing a low homology in CA isoforms. N-terminal residues subjected to both acetylation and phosphorylation are highlighted in dark grey. S, T and Y residues subjected to phosphorylation are highlighted in red. S and T residues subjected to both phosphorylation and O-glycosylation are highlighted in light blue. S and T residues subjected to O-glycosylation are highlighted in pink. C residues involved in disulphide bonds, subjected to S-glutathionylation and S-nitrosylation are highlighted in black, rotten green and yellow, respectively. K residues subjected to non-enzymatic (NE) glycation, acetylation and ubiquitinylation are highlighted in light grey, dark blue and brown, respectively. K residues subjected to both non-enzymatic glycation and acetylation are highlighted in light blue. K residues subjected to both acetylation and ubiquitinylation are highlighted in sugar paper colour. R residues subjected to methylation are highlighted in purple. N residues subjected to N-glycosylation are highlighted in green. S residues subjected to GPI anchoring are highlighted in dark blue.
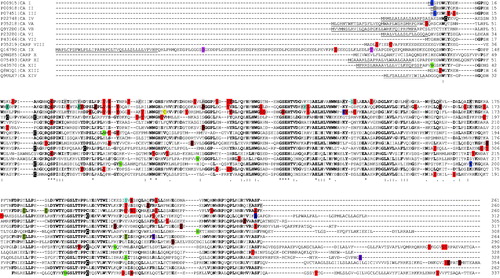
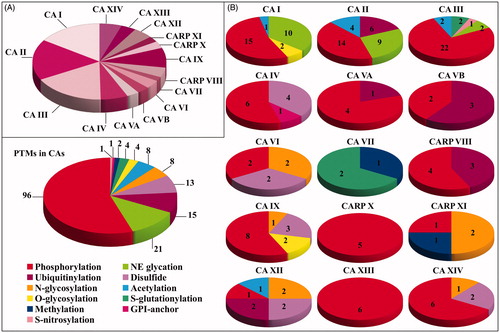
Figure 3. Pie chart representation reporting (A) the number of modified amino acids in the different CA isoforms, and (B) the nature and the number of the modifications present in each CA isoform and in the whole CA family.