Figures & data
Figure 1. Reported colchicine binding site inhibitors (CBSIs).
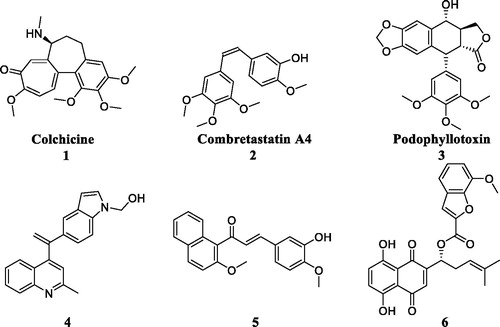
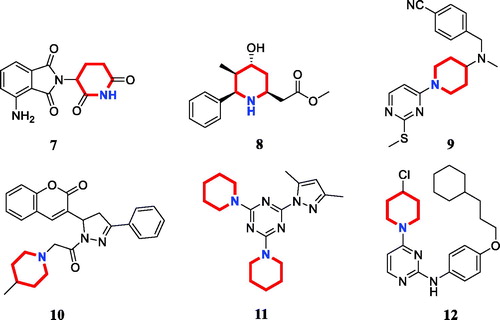
Figure 2. Chemical structures of anticancer piperidine derivatives.
Scheme 1. Reagents and conditions: (i) N,N-dimethylformamide, triethylamine; (ii) 2-chloroacetyl chloride, K2CO3, acetone; (iii) Piperidines or pyrrolidine, NaOH, acetone.
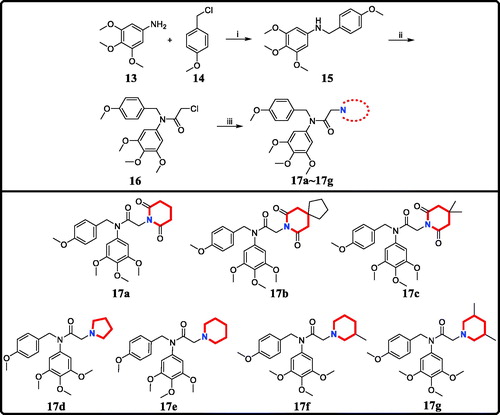
Table 1. Antiproliferative activity of candidate derivatives 17a∼17g.
Figure 3. (A) The cell viability of PC3 cells with the treatment of compound 17a at different concentrations for 48 h. (B) The cell viability of PC3 cells with the treatment of compound 17a at 1 μM for different hours. (C) Colony formation of PC3 cells with the treatment of 17a at various concentrations for 7 days. (D) Colony formation rate. *p < .05 verse control, **p < .01 verse control, ***p < .001 verse control and ****p < .0001 verse control.
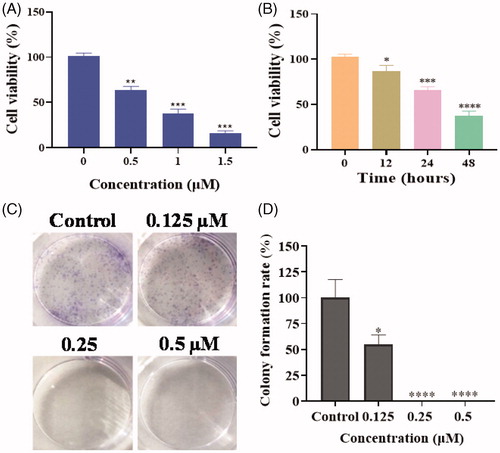
Figure 4. (A) Morphological changes analysis with DAPI staining after 48 h of compound 17a in PC3 cells. (B&C) Quantitative analysis of apoptotic cells using Annexin V-FITC/PI double staining. (D) Expression levels of 17a on apoptosis-related proteins.
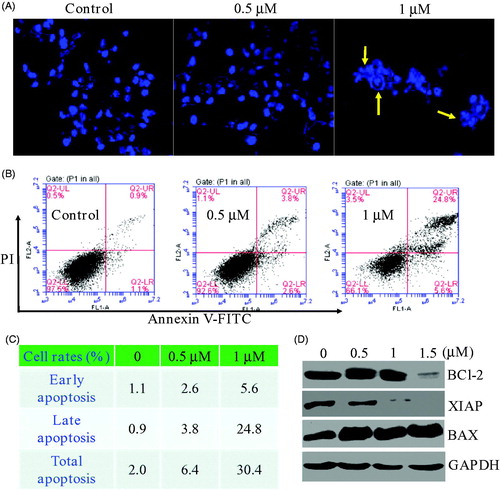
Figure 5. (A) Wound healing assay. (B&C) The migration ability of PC3 cells after the treatment of compound 17a. (D) Expression levels of N-cadherin, Vimentin, and E-Cadherin.
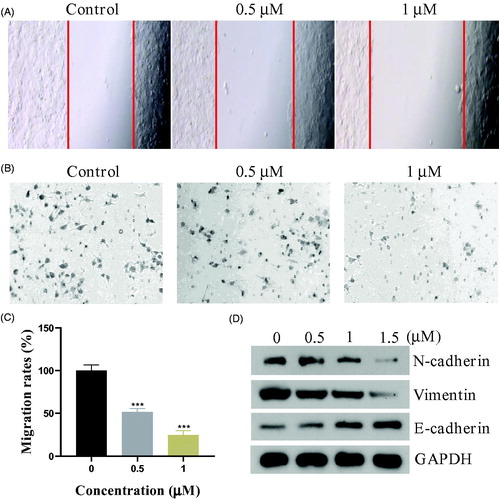
Figure 6. (A) Tubulin polymerisation inhibitory activity of 17a. (B) EBI competition assay on PC3 cells.
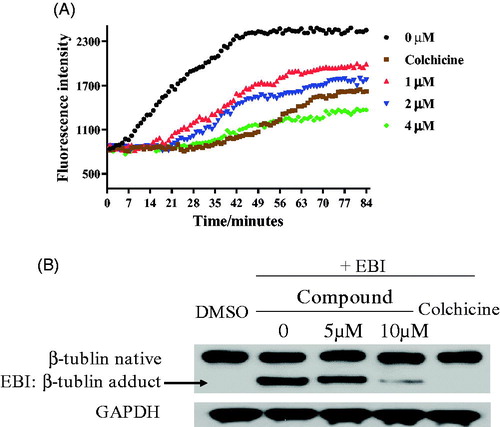
Figure 7. (A,B) 3D binding models of compound 17a in the active sites of tubulin. (C) 2D binding models and hydrogen-bond interactions.
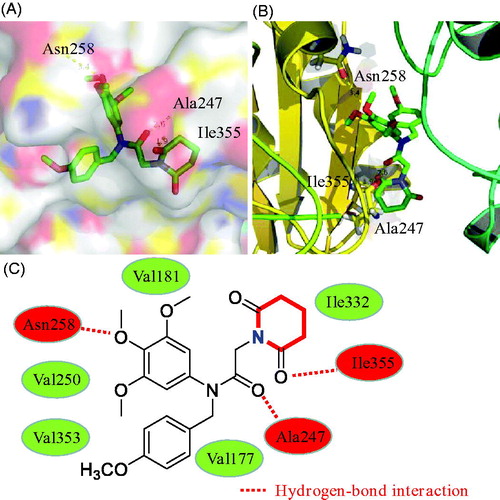
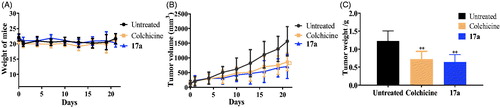
Figure 8. In vivo antitumor effects after the treatment of normal saline (untreated group), colchicine (0.25 mg/kg), compound 17a (50 mg/kg). (A) Weight of mice. (B) Tumour volume. (C) Tumour weight of mice. **p < .01 verse control.