Figures & data
Table 1. Linearity, LOD and LOQ of the xanthones of Garcinia mangostana.
Figure 1. Representative total ion chromatogram of the methanol extracts (A) and aqueous extracts (B) of different parts of Garcinia mangostana. (1) Mangostanol ; (2) 3-Isomangostin ; (3) Garcinone C ; (4) γ-Mangostin ; (5) 8-Deoxygartanin ; (6) α-Mangostin.
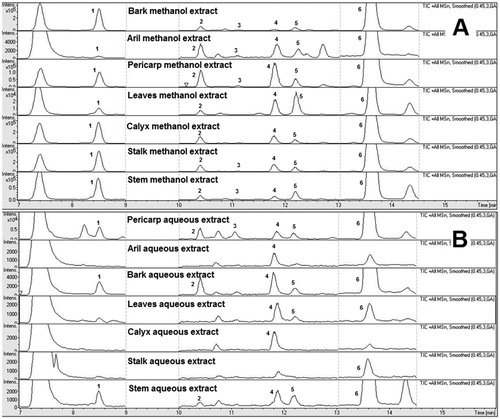
Figure 2. Fragmentation patterns of the xanthones. (1) Mangostanol, (2) 3-Isomangostin, (3) Garcinone C, (4) γ-Mangostin, (5) 8-Deoxygartanin, (6) α-Mangostin.
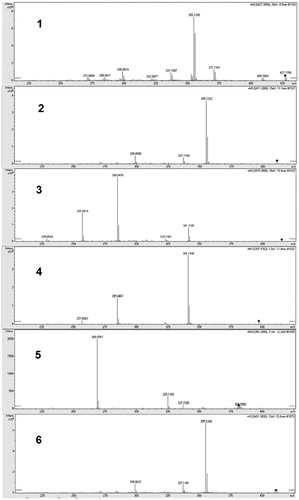
Table 2. Xanthone content in the methanol and aqueous extracts of different parts of Garcinia mangostana.
Table 3. Cholinesterase inhibitory activities of the methanol and aqueous extracts of different parts of Garcinia mangostana.
Figure 3. Scatter plot of IC50 of AChE and BChE versus total xanthone content.
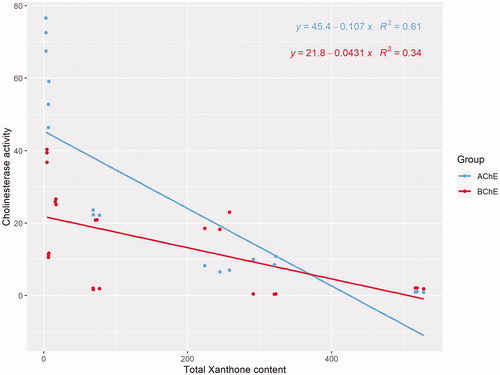
Figure 4. Nonmetric Multidimensional Scaling Ordination of the xanthones. The loading of the variables was projected on the ordination plot. The sample was labelled based on (A) solvent, (B) plant parts. (C) Bubble plot based on the concentration of α-mangostin and γ-mangostin superimposed on the NMDS.
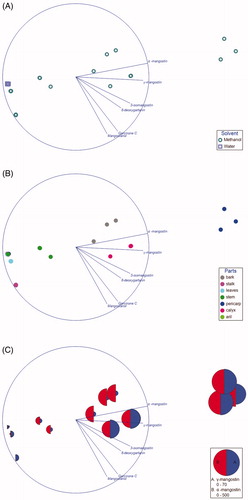
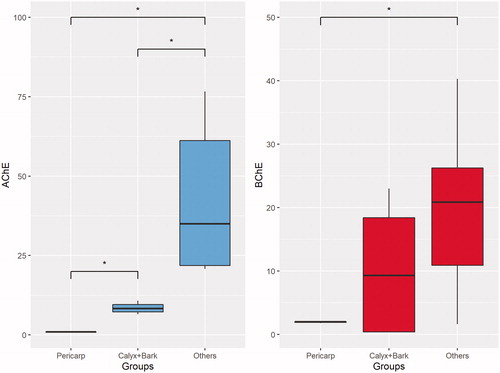
Figure 5. Box plot for comparison of IC50 between “Pericarp”, “Bark + Calyx” and “Others”. (A) AChE, (B) BChE.