Figures & data
Figure 1. The basic skeleton structures of flavonoids and their scaffolds. Basic representative structures of the most common flavonoids classified in this study were drawn with rings and numbered positions.
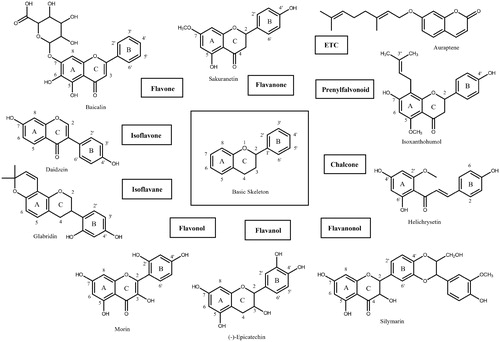
Figure 2. Results from the FRET method. Each data point represents the effect of each inhibitory compound against SARS-CoV-2 3CLpro compared to the control. The RFU are plotted against the log-concentration of inhibitory compounds. Each dot is expressed as the mean ± standard error of the mean (n = 3). RFU: relative fluorescence units.
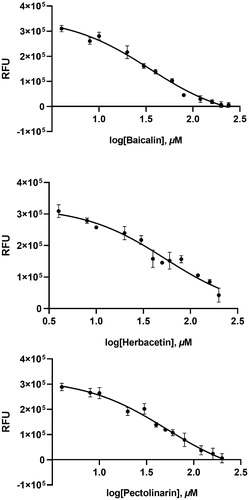
Figure 3. Fluorescence quenching spectra of SARS-CoV-2 3CLpro. A solution containing 2 μM SARS-CoV 3CLpro showed a strong fluorescence emission with a peak at 340 nm at the excitation wavelength of 295 nm. After adding 80 μM each inhibitory compound such as baicalin, herbacetin, and pectolinarin, fluorescence quenching spectra were obtained.
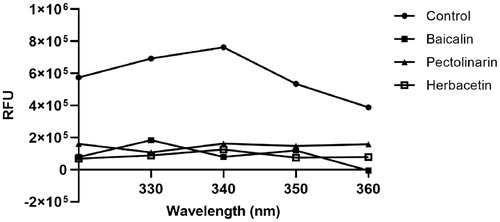
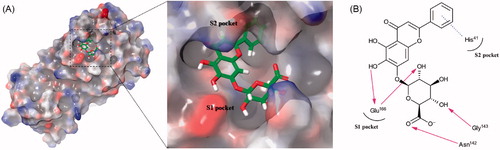
Figure 4. (A) Schematic representation of baicalin docked on the catalytic cavity of SARS-CoV-2 3CLpro. The electrostatic surface potential of SARS-CoV-2 3CLpro docked with baicalin was depicted (red, negative; blue, positive; white, uncharged). The enlarged view represents baicalin in the active site pocket with a semi-transparent view of the molecular surface of SARS-CoV-2 3CLpro. (B) A 2D schematic representation of the interactions of baicalin with the side chains of SARS-CoV-2 3CLpro. The pink arrows represented hydrogen bonds and the blue dot line for π–π stacking.