Figures & data
Table 1. Toxicity and anti-inflammatory activity of target compounds.
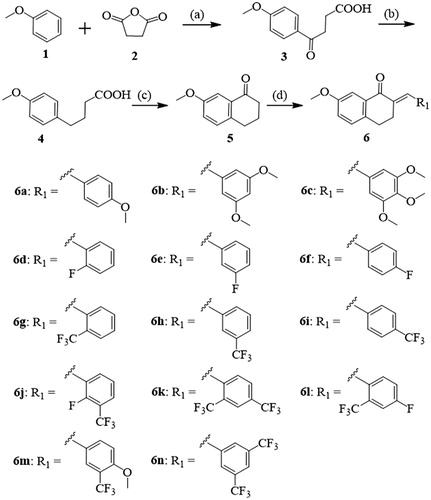
Scheme 1 Synthetic route of compounds 6a-n. Reagents and conditions: (a) AlCl3/CH3NO2, 0 °C, 3 h, 92%; (b) NH2NH2·H2O/KOH/DEG, 180 °C, 3 h, 86%; (c) PPA, 100 °C, 30 min, 65%; (d) Aromatic aldehyde, 20% NaOH (aq.), MeOH, 25 °C, 3–5 h.
Scheme 2 Synthetic route of compounds 7a-c. Reagents and conditions: (a) aldehyde, 20% NaOH (aq.), MeOH, 25 °C, 3‒5 h.
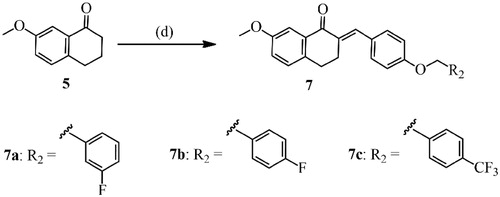
Figure 1 The ORTEP figure of 6 m (displacement ellipsoids with 60% probability).
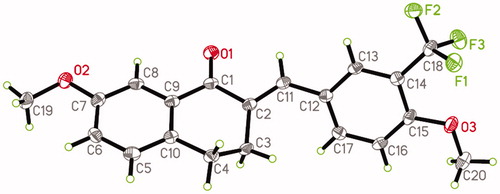
Figure 2. (A) The inhibitory effect of 6 m on ROS production of LPS-stimulated BV2 microglia cells. (B) Statistical analysis of the number of DCF stained cells of LPS-stimulated BV2 microglia cells. Statistical significance is indicated: ∗p < .05, ∗∗p < .01, ∗∗∗p < .001 versus LPS group (one-way ANOVA followed by Dunnett’s test). The data are representative of three independent experiments.
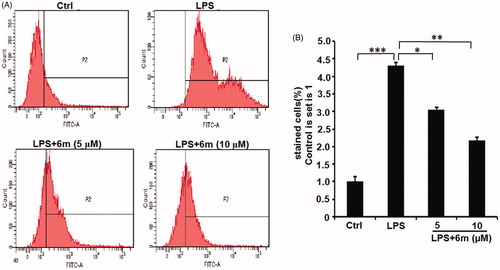
Figure 3. (A) The expression of NLRP3 inflammasome proteins reduced by 6 m. (B) The expression of NLRP3 in LPS-stimulated BV2 microglia cells. (C) The expression of ASC in LPS-stimulated BV2 microglia cells. (D) The expression of Caspase-1 in LPS-stimulated BV2 microglia cells. Statistical significance is indicated: *p < .05, **p < .01 versus LPS group (one-way ANOVA followed by Dunnett’s test). The data are representative of three independent experiments.
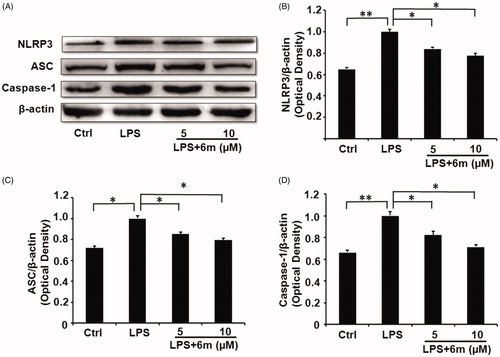
Figure 4. The effects of 6 m on the secretion of cytokines from LPS-stimulated BV2 microglia cells. (A) Secretion of IL-6 from LPS-stimulated BV2 microglia cells. (B) Secretion of IL-1β from LPS-stimulated BV2 microglia cells. (C) Secretion of IL-18 from LPS-stimulated BV2 microglia cells. (D) Secretion of IL-10 from LPS-stimulated BV2 microglia cells. Statistical significance is indicated: *p < .05, **p < .01, ***p < .001 versus LPS group (one-way ANOVA followed by Dunnett’s test). The data are representative of three independent experiments.
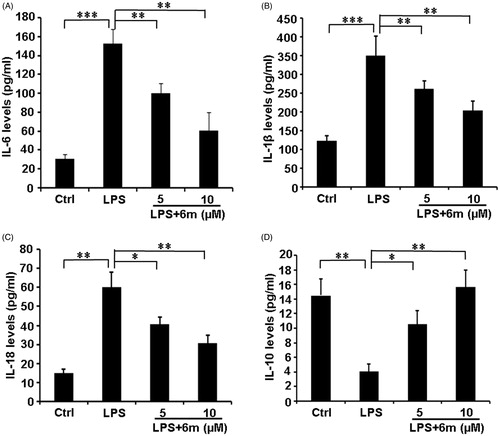
Figure 5. The effect of 6 m on the polarisation of LPS-stimulated BV2 microglia cells by flow cytometry. (A) iNOS and CD86 expression in LPS-stimulated BV2 microglia cells. (B) CD206 and Arg 1 expression in LPS-stimulated BV2 microglia cells. The number of (C) double stained iNOS and CD86, (D) double stained CD206 and Arg 1, and (E) relative expression of double stained (iNOS and CD86) and double stained (CD206 and Arg1) cells of LPS-stimulated BV2 microglia cells. Statistical significance is indicated: *p < .05, ***p < .01 versus LPS group (one-way ANOVA followed by Dunnett’s test). The data are representative of three independent experiments.
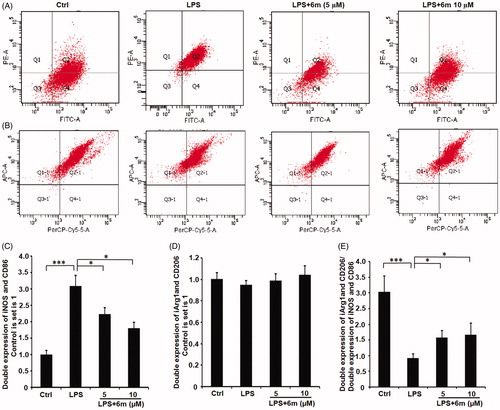
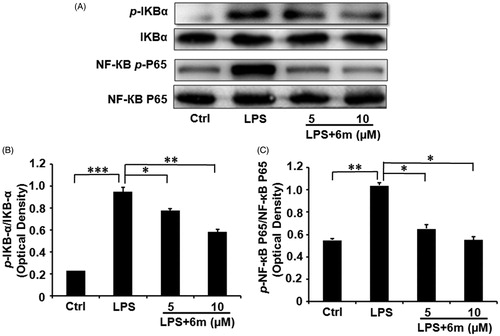
Figure 6. (A) The inhibitory effects of 6 m on phosphorylation of IκBα and p65 in LPS-stimulated BV2 microglia cells. (B) The relative expression of p-IκB-α and IκB-α. (C) The relative expression of p-NF-κB and p65/NF-κB p65. Statistical significance is indicated: *p < .05, **p < .01, ***p < .01 versus LPS group (one-way ANOVA followed by Dunnett’s test). The data are representative of three independent experiments.