Figures & data
Figure 1. General synthetic procedure for title compounds 1–13. R = 1: 2-Cl; 2: 3-Cl; 3: 4-Cl; 4: 2-F; 5: 4-F; 6: 2,4-di-F; 7: 2,6-di-F; 8: 2-NO2; 9: 4-NO2; 10: 4-Br; 11: 4-Me; 12: 4-OMe; 13: H.
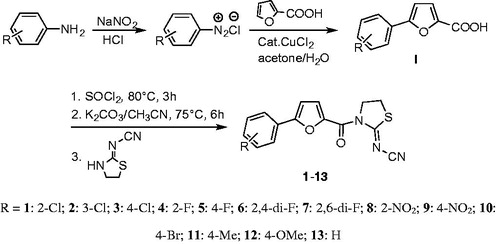
Figure 2. Single crystal structure of compound 6.
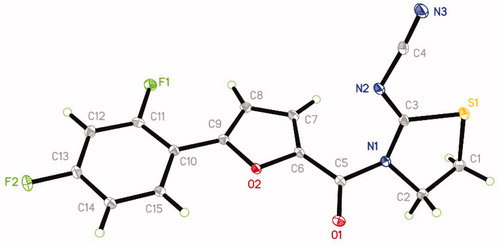
Table 1. Chemical structures of 13 thiazolidin-2-cyanamide derivatives and the inhibitory activity against EcGUS-mediated PNPG hydrolysis.
Figure 3. The dose-dependent inhibition curves of inhibitors on PNPG-hydrolyzing activity of EcGUS. (A) Compounds 1–8; (B) compounds 9–13, and DSL. All data were expressed as mean ± standard deviation of triplicate reactions.
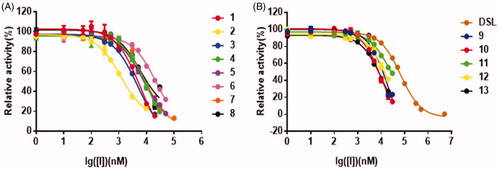
Figure 4. The Lineweaver–Burk plots of (A) compound 1, (B) compound 2, and (C) compound 3 against EcGUS. All data were expressed as mean ± standard deviation of triplicate reactions.
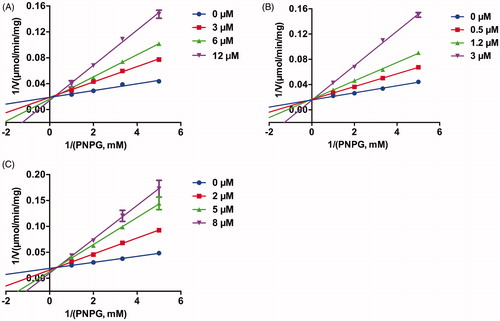
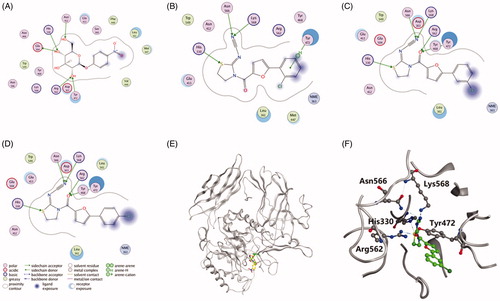
Figure 5. Ligand interactions of (A) PNPG, (B) compound 1, (C) compound 2 and (D) compound 3 with EcGUS. (E) Stereo diagram of PNPG combined with compound 2 in the active site of EcGUS. (F) Binding mode of compound 2 in the active site of EcGUS.