Figures & data
Table 1. Chemical structures of the α-syn aggregation inhibitors used as training set (TS).
Figure 1. (A) Best scored ligand-based pharmacophore model constituted by two hydrogen bond acceptors (red spheres), two hydrophobic features (yellow spheres), one aromatic feature (blue circle). Forty-five excluded volumes are represented by grey spheres. (B) TS molecules aligned with the highest scored pharmacophore model.
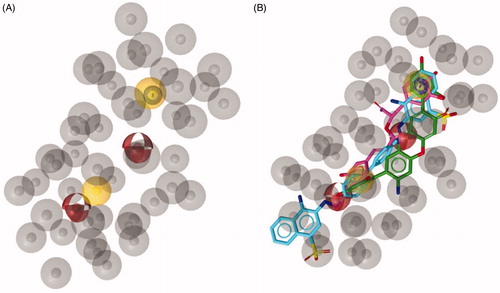
Figure 2. (A) Chemical structure of compounds 1a-c. (B) Compound 1a aligned to the pharmacophore model. Compound 1a is represented by grey sticks.
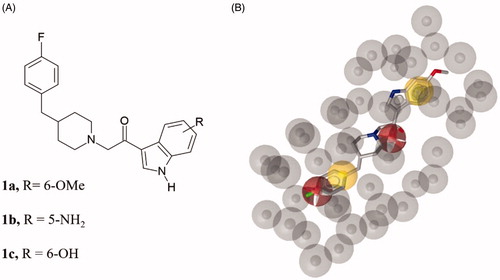
Figure 3. (A) Chemical structures of compounds 2, 3 and 4. (B) Alignment of each of the reported hits (represented by pink (2), orange (3) and yellow (4) sticks) with the pharmacophore model.
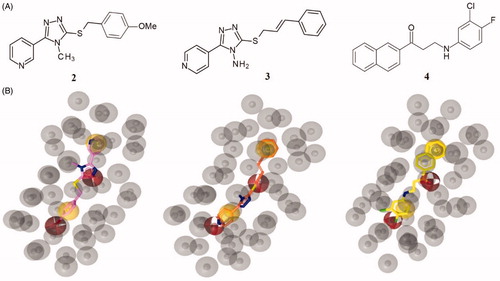
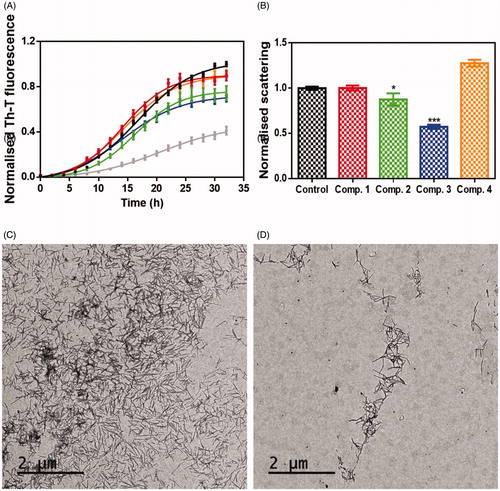
Figure 4. Inhibitory in vitro characterisation of compounds 1 to 4. (A) Aggregation kinetic of α-syn in absence (black) and presence of 100 µM of Compound 1 (red), compound 2 (green), compound 3 (blue), compound 4 (orange) and SynuClean-D (grey), followed by Th-T fluorescence emission. (B) Light-scattering measurements at 300 nm in the absence (black) and presence of 100 µM of Compound 1 (red), compound 2 (green), compound 3 (blue) and compound 4 (orange). (C and D) Representative TEM images of untreated (C) and compound 3 treated samples (D). Th-T fluorescence is plotted as normalised means. Final points were obtained at 48 h. Error bars are represented as SE of mean values; ** p < 0.01 and *** p < 0.001.
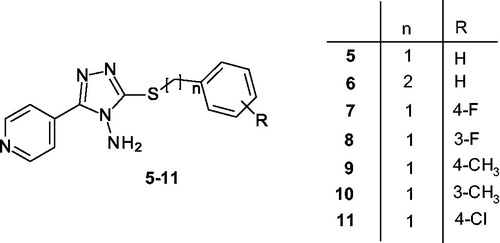
Scheme 1. Designed pyridinyltriazole derivatives 5–11 inspired by compound 3.
Scheme 2. Reagents and conditions: i) Ar(CH2)nBr, NaOH, MeOH, rt.
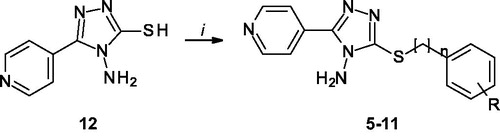
Figure 5. Inhibitory in vitro characterisation of tested compounds 5–11. (A and B) Aggregation kinetics of α-syn in the absence (black) and presence of 100 µM of compounds 5 (red), 6 (green), 7 (violet), 8 (orange), 9 (blue), 10 (brown), 11 (yellow) and SynuClean-D (grey), followed by Th-T fluorescence emission. (C) Light-scattering measurements at 300 nm in the absence (black) and presence of 100 µM of compounds 5 (red), 6 (green), 7 (violet), 8 (orange), 9 (blue), 10 (brown) and 11 (yellow). (D to G) Representative TEM images of untreated (D) and 5 (E), 8 (F), 9 (G) and 11 (H) treated samples. Th-T fluorescence is plotted as normalised means. Final points were obtained at 48 h. Error bars are represented as SE of mean values; ** p < 0.01 and *** p < 0.001.
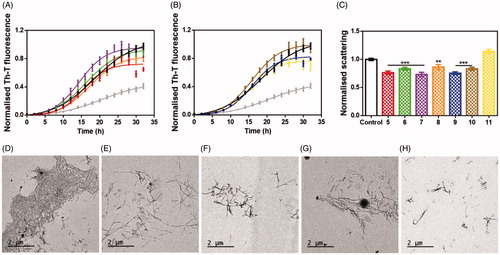
Figure 6. Binding site of α-syn identified through docking studies for this class of inhibitors. The image is created by PyMOL software (https://pymol.org).
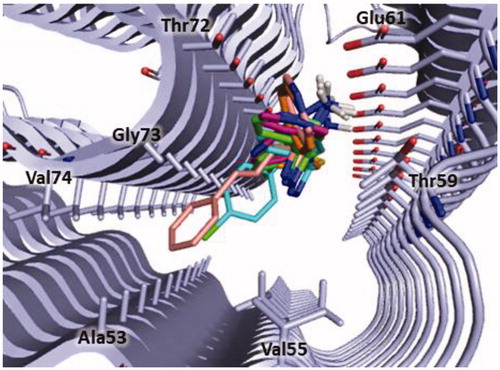
Figure 7. Plausible binding mode of compound 3 (pink stick). The interacting residues of the binding site are represented as light blues stick. The image is created by PyMOL software (https://pymol.org).
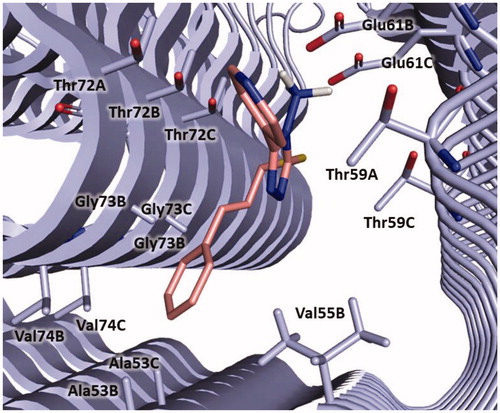
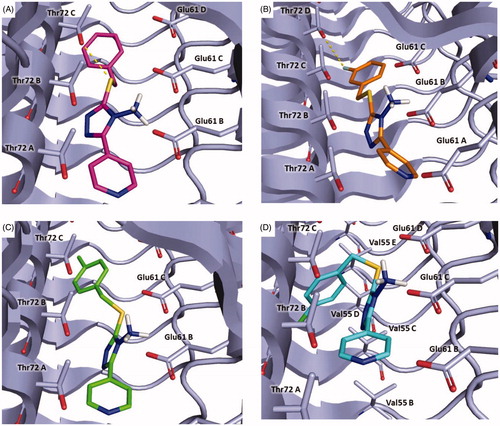
Figure 8. Plausible binding modes for compound 5 (magenta stick, panel A), 8 (orange stick, panel B), 9 (green stick, panel C) and 11 (cyan stick, panel D). The interacting residues of the binding site are represented as light blues stick. The images are created by PyMOL software (https://pymol.org).