Figures & data
Figure 1. The chemical structures of benzyl isothiocyanate (BITC) and phenethyl isothiocyanate (PEITC).
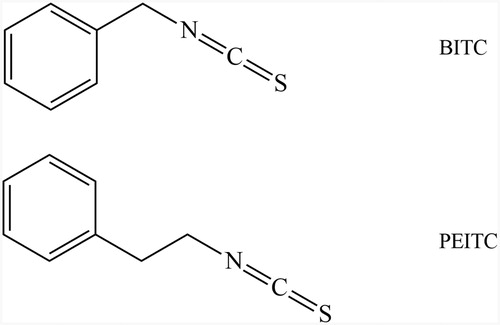
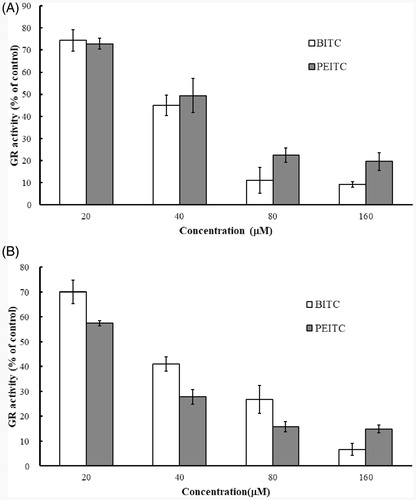
Figure 2. Inhibition of GR by BITC and PEITC. yGR or hGR was incubated with 20, 40, 80 and 160 µM BITC or PEITC for 2 h, and the GR activity was determined and presented as the percentage of the control. The results are shown as the means ± SD of three independent experiments.
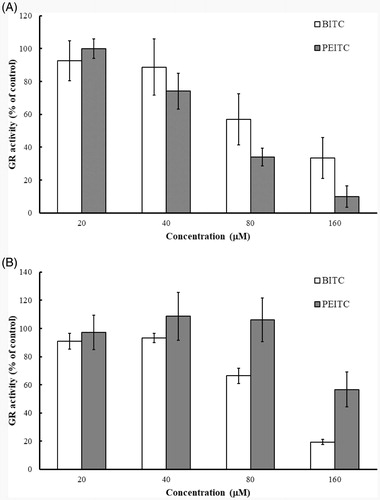
Figure 3. Time- and concentration-dependent inhibition of yGR by BITC. The natural logarithm of remaining yGR activity (% of control) is plotted against time. The yGR was incubated with various concentrations of BITC (◆, 20 µM; ■, 40 µM; ▲80 µM; ○,160 µM), and aliquots were withdrawn at different time intervals (30, 60, 90 and 120 min) and the remainig GR activity was detected. The data were derived from one of triplicate experiments.
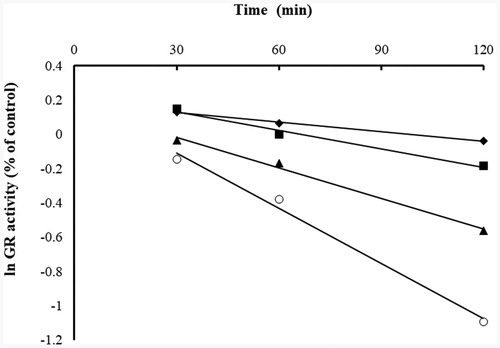
Figure 4. Double-reciprocal plot of the apparent rate constants of inhibition (kapp, slope from ) versus the reciprocal of inhibitor (BITC) concentration ([I]). The Ki and kinact values were calculated to be 259.87 µM and 0.0266 min−1, respectively, based on the method of Kitz and WilsonCitation21.
![Figure 4. Double-reciprocal plot of the apparent rate constants of inhibition (kapp, slope from Figure 2) versus the reciprocal of inhibitor (BITC) concentration ([I]). The Ki and kinact values were calculated to be 259.87 µM and 0.0266 min−1, respectively, based on the method of Kitz and WilsonCitation21.](/cms/asset/badc8e81-ca05-4b2e-a08b-3d02313a8490/ienz_a_1822828_f0004_b.jpg)
Figure 5. Determination of the irreversibility of GR inhibition by BITC via dialysis. yGR (6 U/mL) was incubated with 1 mM BITC at room temperature in the presence of 0.2 mM NADPH for 2 h. Then extensive dialysis was performed in a Slide-A-Lyzer dialysis cassette for 24 h. Aliquots were withdrawn at indicated time intervals, and the remaining GR activity was determined as described in Material and Methods. No recovery of GR activity was observed after 24 h of dialysis in BITC-treated yGR samples. The results are presented as the means ± SD of three independent experiments. ◆, control GR; ▲, BITC-inhibited GR.
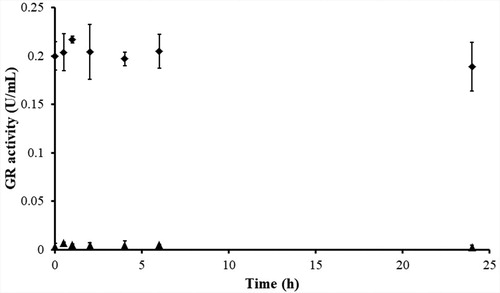
Figure 6. Substrate protection of GR from BITC inhibition. Reduced yGR (1.5 U/mL) was incubated with 0.2 mM BITC in the presence or absence of GSSG (0.1, 0.2, and 0.4 mM) in PE buffer at room temperature for 2 h. An aliquot was withdrawn and the remaining GR activity analysed as described in Material and Methods. The results are presented as the means ± SD of three independent experiments. *p < 0.001 versus control group.
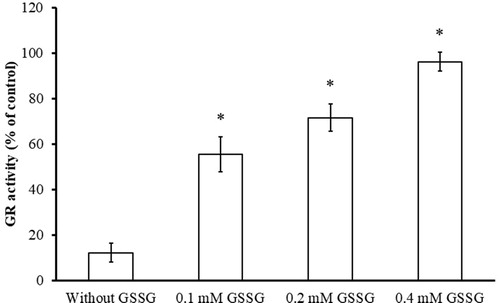
Figure 7. Determination of NADPH-dependent GR inhibition by BITC (A) and PEITC (B). The yGR (1.5 U/mL) was incubated with 0.2 mM BITC or PEITC in the absence or presence of 0.2 mM NADPH in PE buffer at room temperature for 2 h. An aliquot was withdrawn and the remaining GR activity analysed as described in Material and Methods. The results are presented as the means ± SD of three independent experiments. *p < 0.001 versus control group.
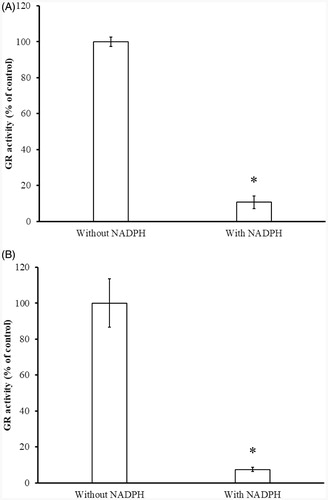
Figure 8. Mass spectrum of trypsinized yGR. (A) Mass spectrum of mono-benzyl thiocarbamoylated peptide ALGGTCVNVGCVPK containing active site of yGR. (B, C) Fragmentation of precursor ion m/z 733.8515 [(M + 2H)2+] eluting at 26.16 min from trypsin-digested BITC-treated yGR. A series of fragment ions were observed including the y8 (VNVGCVPK) ion at m/z 815.4444 and the mono-benzyl thiocarbamoylated y9 ion at m/z 1067.4705. (D) Mass spectrum of unmodified ALGGTCVNVGCVPK containing active site of yGR. (E) Fragment ions of precursor ion m/z 659.3369 [(M + 2H)2+] eluting at 18.90 min.
![Figure 8. Mass spectrum of trypsinized yGR. (A) Mass spectrum of mono-benzyl thiocarbamoylated peptide ALGGTCVNVGCVPK containing active site of yGR. (B, C) Fragmentation of precursor ion m/z 733.8515 [(M + 2H)2+] eluting at 26.16 min from trypsin-digested BITC-treated yGR. A series of fragment ions were observed including the y8 (VNVGCVPK) ion at m/z 815.4444 and the mono-benzyl thiocarbamoylated y9 ion at m/z 1067.4705. (D) Mass spectrum of unmodified ALGGTCVNVGCVPK containing active site of yGR. (E) Fragment ions of precursor ion m/z 659.3369 [(M + 2H)2+] eluting at 18.90 min.](/cms/asset/989b0d9c-3d1b-4201-b856-fbb2cecfc1f7/ienz_a_1822828_f0008_b.jpg)
Figure 9. Proposed mechanism of yGR inhibition by BITC. The tandem mass analysis of the BITC-inhibited yGR revealed that only the thiol on Cys61 was mono-benzyl thiocarbamoylated by BITC, resulting in irreversible inhibition.
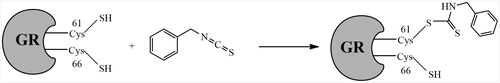
Table 1. Observed ions of peptide benzyl thiocarbamoylated ALGGTC*VNVGCVPK and ALGGTCVNVGCVPK and their corresponding fragment ions in the tandem mass spectrum of trypsin-digested BITC-treated yeast GR.
Figure 10. Inhibition of intracellular GR by BITC and PEITC in A375 (A) and A2780 (B) cells. A375 and A2780 cells were incubated in the presence of 20, 40, 80 and 160 µM BITC or PEITC for 2 h, and the GR activity was determined and presented as the percentage of the control. The results are shown as the means ± SD of three independent experiments.