Figures & data
Scheme 1. Synthesis of intermediate products and target products of N-alkyl-deoxynojirimycin derivatives. Reagents and condition: (a) K2CO3, acetone, dibromo alkane, 65 °C, overnight or Et3N, acetone, dibromo alkane, 65 °C; (b) K2CO3, DMF, 85 °C, 6 h.
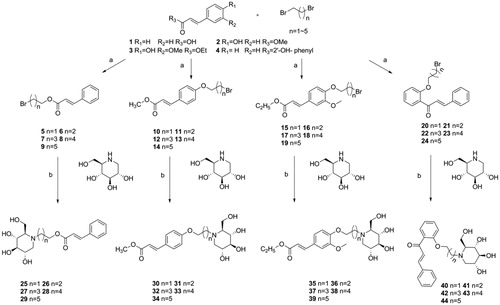
Table 1. In vitro α-glucosidase inhibitory activity of compound 25–44.
Figure 1. The general structural formula of N-alkyl-deoxynojirimycin derivatives.
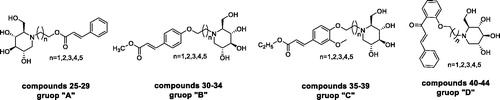
Figure 2. Kinetic analysis of α-glucosidase inhibition by compounds 43, 40, and 34. (A) The Lineweaver–Burk plots in the absence and presence of different concentrations of compound 43; (B) The Lineweaver–Burk plots in the absence and presence of different concentrations of compound 40; (C) The Lineweaver–Burk plots in the absence and presence of different concentrations of compound 34.
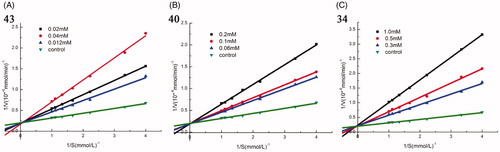
Table 2. The detailed information of molecular docking results of compounds 34, 40, 41, 43, and acarbose.
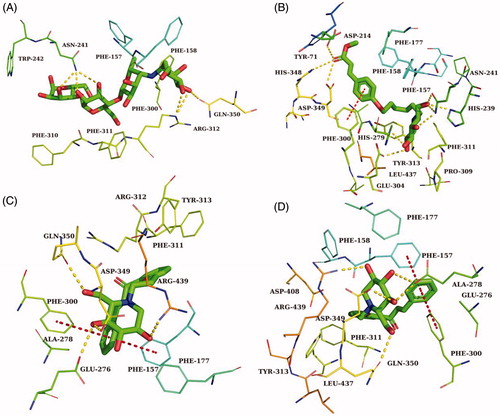
Figure 3. (A) The predicted binding mode of compound 43 in the active site and substrate-binding pocket. (B) the interactions between 43 and modelled α-glucosidase. The yellow dashed lines represent hydrogen bonds and the red dashed lines represented π–π interactions.
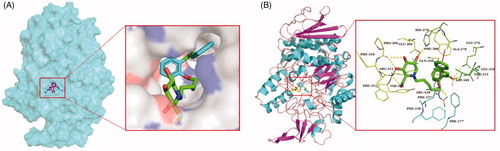
Figure 4. The predicted binding mode of acarbose (A), 34 (B), 41 (C) and 40 (D) in the active site pocket. The yellow dashed lines represented hydrogen bonds and the red dashed lines represented π–π interactions.