Figures & data
Figure 1. Broaden screening against Aβ and tau-related targets of a library of multifunctional 5-HT6 antagonists and cholinesterase inhibitors.
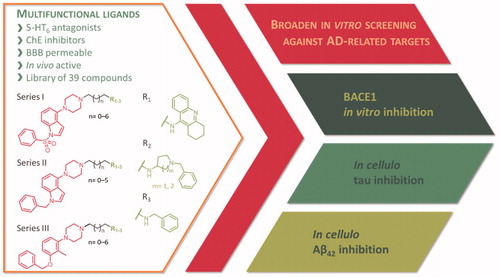
Table 1. Inhibition of tau and Aβ42 aggregation and BACE1 by compounds 1–16 (series I).
Table 2. Inhibition of tau and Aβ42 aggregation and BACE1 by compounds 17–26 (series II).
Table 3. Inhibition of tau and Aβ42 aggregation and BACE1 by compounds 27–39 (series III).
Figure 2. The predicted binding mode of compounds 8 (magenta), 21 (green), and 32 (yellow) in the binding site of BACE1. The detected cation-π interactions were marked as red lines connecting the centre of the aromatic ring and guanidine carbon of Arg296.
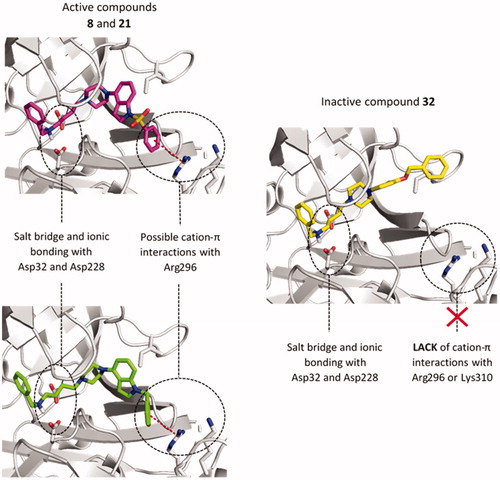
Figure 3. Differences in the binding mode of compounds 1 (cyan), 4 (blue) and 24 (orange) within BACE1. The detected cation-π interactions were marked as red lines connecting the centre of the aromatic ring and guanidine carbon of Arg296 (4.3 Å) or Lys310 (5.6 Å).
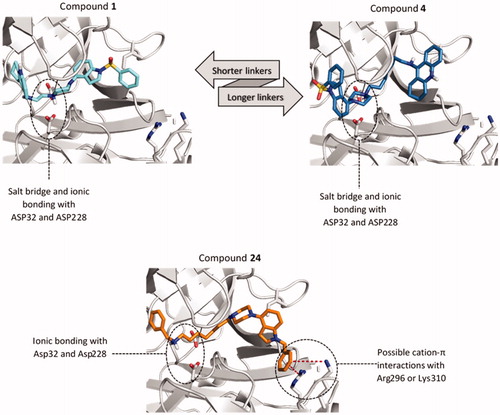
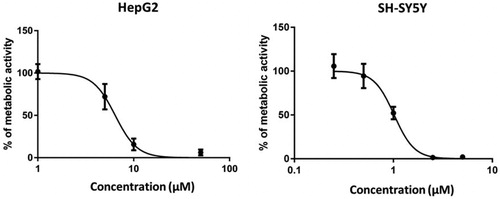
Figure 4. Compound 3 exerts concentration-dependent influence on the metabolic activity of HepG2 and SH-SY5Ycells. HepG2 and SH-SY5Ycells were incubated in the presence of increasing concentrations of compound 3 (1–100 µM) and (0.25–5 µM), respectively. After 24 h, cell viability was evaluated by MTS assay. A control group (DMSO) was considered as 100% of cell viability. Cells were treated in quadruplicate. The values are the mean ± SD of two independent experiments.