Figures & data
Table 1. Kinetic parameters for the CO2 hydration reaction of α-CAs human cytosolic isozymes hCA I and II and VchCA measured at 20 °C and pH 7.5 in 10 mM HEPES buffer and 20 mM Na2SO4, and VchCAβ and VchCAγ measured at 20 °C, pH 8.3 in 20 mM TRIS buffer and 20 mM NaClO4Citation45,Citation52–55.
Figure 1. Structure of sulphonamides/sulfamates previously investigated as VchCAs inhibitorsCitation45.
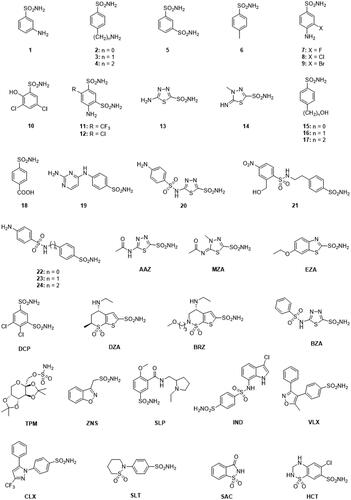
Table 2. Inhibition data of human isoforms hCA I and hCA II, and VchCA, VchCAβ and VchCAγ from V. cholerae with sulphonamides 1–24 and the clinically used drugs AAZ-HCT by a stopped-flow CO2 hydrase assayCitation45.
Figure 2. Most populated binding conformation along the MD trajectory for (A) 20 (blue), (B) EZA (tan), (C) BRZ (green), and (D) 2 (pink) within VchCA active site. H-bonds and salt bridge interactions are depicted as black and magenta dashed lines, respectively. The occupancy over the MD simulation of interactions not involving the zinc-binding group is indicated as percentage.
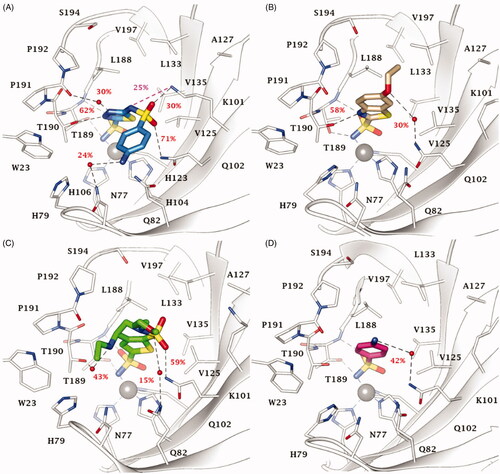
Figure 3. Most populated binding conformation along the MD trajectory for (A) 13 (aquamarine), (B) 15 (pink), (C) 24 (grey), and (D) 18 (orange) within VchCAβ active site. H-bonds and π-π stacking interactions are depicted as black and cyan dashed lines, respectively. The occupancy over the MD simulation of interactions not involving the zinc-binding group is indicated as percentage.
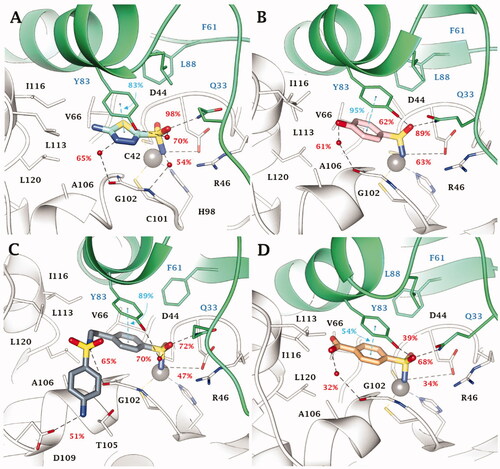
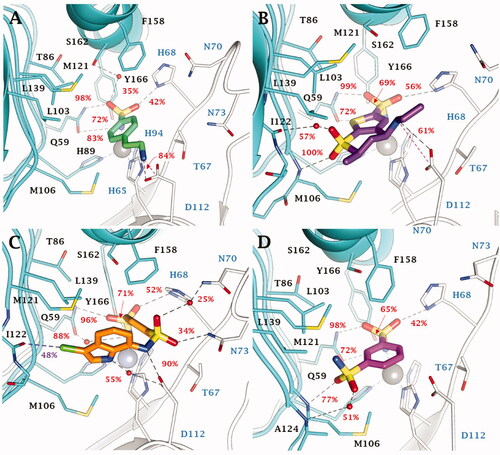
Figure 4. Most populated binding conformation along the MD trajectory for (A) 4 (spring green), (B) DZA (forest green), (C) IND (yellow), and (D) 5 (orchid) within VchCAγ active site. H-bonds, salt bridge, π-π stacking interactions, and halogen bonds are depicted as black, magenta, cyan, and green dashed lines, respectively. The occupancy over the MD simulation of interactions not involving the zinc-binding group is indicated as percentage.