
Figures & data
Figure 1. Drugs containing coumarin core (A) and antitumor agents containing dithiocarbamate fragment (B).
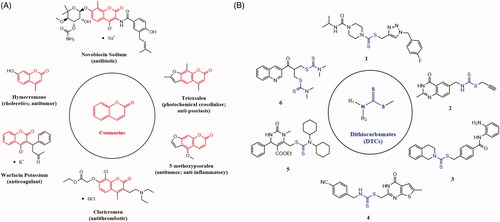
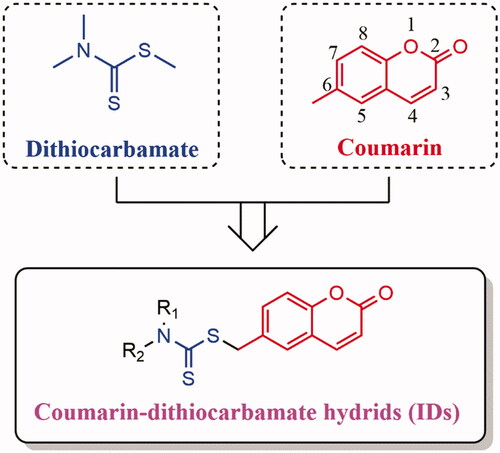
Figure 2. Design strategy of the novel coumarin-dithiocarbamate derivatives (IDs).
Scheme 1. Synthetic routes of novel coumarin-dithiocarbamate derivatives (IDs). Reagents and Conditions: (a) CCl4, AIBN (cat.), 90 °C, reflux, 10 h; (b) appropriate secondary amines, CS2, alkali (KOH, K2CO3 or K3PO4), solvent (ethanol, dioxane/H2O (1/4, v/v) or actone), rt, 12–24 h.
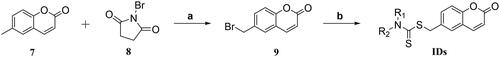
Table 1. Structures of novel coumarin-dithiocarbamate derivatives (IDs).
Figure 3. The inhibitory activities of IDs against different human CRC cell lines and normal human colon epithelial cells. (A–C) RKO, SW620 and SW480 cells were treated with IDs (ID-1 ∼ ID-20) and 5-FU for 72 h at 10 μM and then cell viability was determined by MTS assay. (D) NCM460 cells were treated with IDs (ID-1 ∼ ID-20) and 5-FU for 48 h at 10 μM and then cell viability was determined by MTS assay. (E-G) RKO, SW620 and SW480 cells were treated with ID-11 for 72 h at variable concentrations (20, 10, 5, 2.5, 1.25, 0.625 μM) and then cell viability determined by MTS assay, finally the IC50 values were calculated. (H) NCM460 cells were treated with ID-11 for 48 h at variable concentrations and then cell viability determined by MTS assay, finally the IC50 values were calculated.
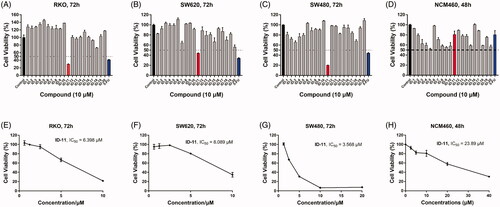
Figure 4. Effects on colony formation of different CRC cell lines by treatment of compound ID-11. (A) SW620 cells. (B) SW480 cells. Cells after treating with ID-11 (0, 4, 8, 16, and 32 μM) for 24 h, continue to cultivate with fresh culture medium for 10 days and then fixed, stained, air-dried and photographed.
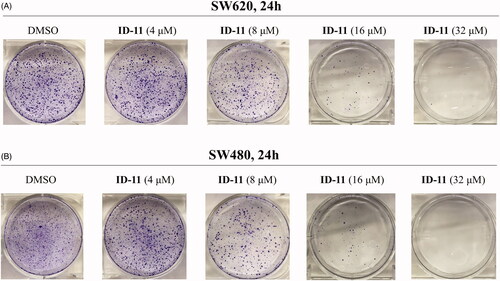
Table 2. BRD4 inhibitory activities of IDs in vitro.
Figure 5. Proposed binding mode of ID-11 with BRD4. (A) Crystal structure of BRD4 bound to (+)-JQ1 (yellow stick, in which carbon atoms in yellow, chlorine atom in green, sulphur atom in orange yellow, oxygen atoms in red and nitrogen atoms in blue) (PDB ID: 3MXF); (B) Docking conformation of ID-11 (green stick, in which carbon atoms in green, sulphur atom in orange yellow, oxygen atoms in red and nitrogen atoms in blue) with BRD4 (PDB ID: 3MXF); (C) Superimposition of (+)-JQ1 (yellow stick) and ID-11 (green stick) in their putative bioactive conformations with BRD4 (PDB ID: 3MXF).
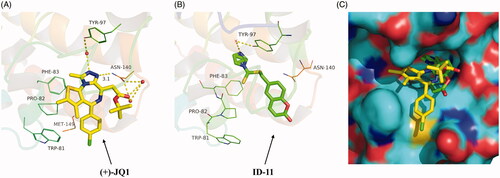
Figure 6. Compound ID-11 induced G2/M phase arrest in CRC cell lines. (A) SW620 and SW480 cells were incubated with ID-11 for 24 h at concentration of 0, 8, and 16 μM. Cells were harvested and stained with PI and then cell cycle distributions were measured by flow cytometry. (B) Histogram of G2/M phase distributions. (C) The expression levels of G2/M phase related proteins were determined by western blot assay. Actin was used as the internal control. Error bar original from three independent experiments. (**p < 0.01; ***p < 0.001 vs. control).
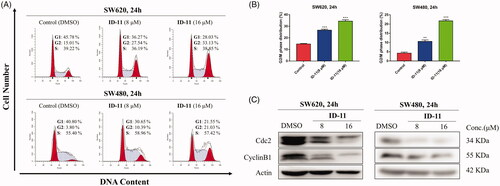
Figure 7. Compound ID-11 induced apoptosis in CRC cell lines. (A) SW620 and SW480 cells were incubated with ID-11 for 24 h at concentration of 0, 8, and 16 μM. Cells were harvested and stained with PI/Annexin V and then cell distributions were measured by flow cytometry. (B) Histogram of apoptotic cells. (C) The expression levels of apoptosis-related proteins were determined by western blot assay. Actin was used as the internal control. Error bar original from three independent experiments. (*p < 0.05; ***p < 0.001 vs. control).
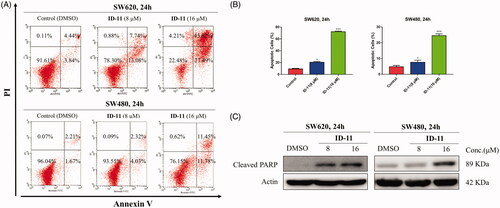
Figure 8. Effects on c-Myc and Bcl-2 protein and mRNA expression in CRC cell lines by treatment of compound ID-11. (A) The expression levels of proteins c-Myc and Bcl-2 in SW620 and SW480 cells. Cells after treating with ID-11 (0, 16, and 24 μM) for 24 h, proteins were extracted and the relative expression levels were determined by western blot assay. (B) The mRNA expression levels of c-Myc and Bcl-2 in SW620 and SW480 cells. Cells after treating with ID-11 (0, 16, and 24 μM) for 24 h, the total RNA was extracted, quantified and the mRNA levels of c-Myc and Bcl-2 were determined by qRT-PCR.
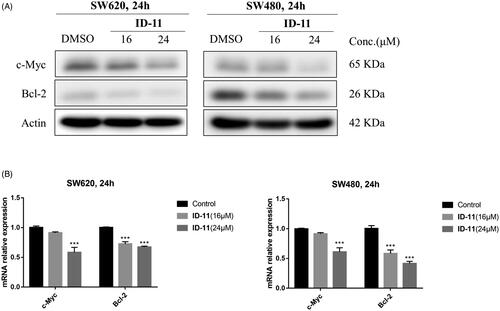
Table 3. Molecular properties prediction of compound ID-11a.