Figures & data
Table 1. Chemical, analytical, and physical data of derivatives EMAC10157 a-b-d-g and EMAC10160 a-b-d-g.
Table 2. 1H NMR and 13C NMR data of derivatives EMAC10157a-b-d-g and EMAC10160a-b-d-g.
Figure 1. Newly synthesised coumarin and psoralen derivatives.
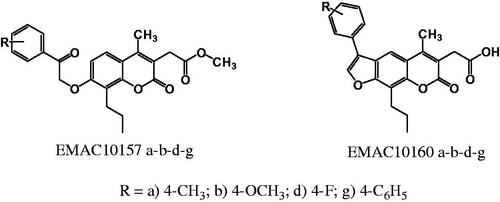
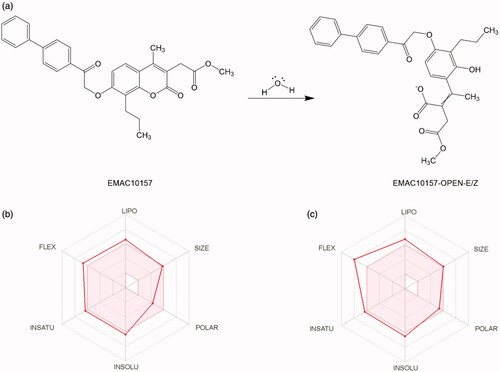
Figure 2. (a) Esterase activity of carbonic anhydrase on compound EMAC10157gCitation34. (b, c) Oral bioavailability radar profile.
Scheme 1. Synthetic pathway to compounds EMAC10157 a-b-d-g and EMAC10160 a-b-d-g. Reagents and conditions: (i) dimethylacetylsuccinate, H2SO4 98% R.T.; (ii) α-halogeno arylketone, dry acetone, K2CO3, reflux; (iii) NaOH 1 N, reflux.
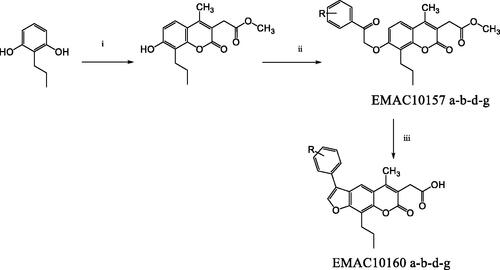
Table 3. Inhibition data towards hCA I, II, IX, and XII of compounds EMAC10157a-b-d-g and EMAC10160 a-b-d-g.
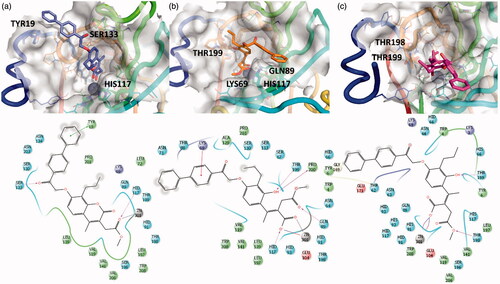
Figure 3. 3D representation of the putative binding mode obtained by docking experiments. (a) hCA-IX – EMAC10157g, (b) hCA-IX – EMAC10157g-openE, and (c) hCA-IX – EMAC10157g-openZ and the relative 2D representation of the complexes stabilising interactions with the binding site residues represented with different colour depending on their chemical-physical properties: green, hydrophobic; cyan, polar; violet, positive; red, negative charged residues; grey, metal atoms. Instead, magenta arrows indicate the formation of a hydrogen bond between protein and ligand, while grey lines indicate the interaction with the complexed ion.
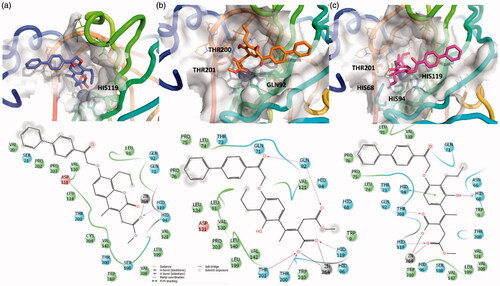
Figure 4. 3D representation of the putative binding mode obtained by docking experiments. (a) hCA-XII – EMAC10157g, (b) hCA-XII – EMAC10157g-openE, and (c) CA-XII- EMAC10157g-openZ and the relative 2D representation of the complexes stabilising interactions with the binding site residues.