Figures & data
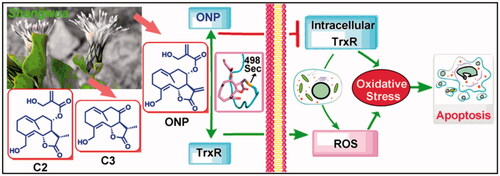
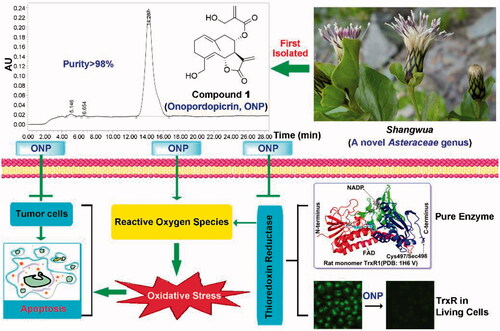
Figure 1. Compounds 1-3 isolated for the first time from Shangwua, a new genus of Asteraceae. (A) Tibetan plateau and Himalayas plant Shangwua. (B) Structure of compounds 1–3, namely ONP, C2, and C3. (C) Purity analysis of ONP was analyzed by HPLC.
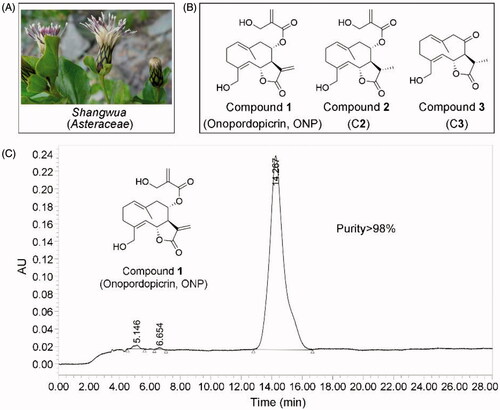
Figure 2. Inhibiting tumor cell growth by ONP. (A) Cytotoxicity of ONP, C2, and C3 to HeLa cells. After treating HeLa cells with the indicated concentrations of ONP, C2, and C3 for 48 h, the cell viability of HeLa cells was determined by the MTT method. (B) Inhibition of the growth of HeLa cells in a time-dependent manner by ONP. HeLa cells were treated with ONP at designated concentrations for 24, 48, and 72 h, and the cell survival rate was detected by the MTT method. (C) Cytotoxicity of ONP towards multiple tumor cell lines. After different concentrations of ONP were incubated with HeLa, HepG2, and A549 cells for 48 h, the cell viability was detected by the MTT method. (D) Selectivity of ONP for tumor cells. The designated concentrations of ONP acted on HeLa cells, BEAS-2B, and L02 cells for 24 h, and the cell viability was detected by the MTT method. After treatment of HeLa cells, BEAS-2B, and L02 cells with ONP at specified concentrations for 24 h, the cell viability was detected by the MTT method. Data are expressed as mean ± S. E. of three experiments. **p < 0.01 versus the control groups.
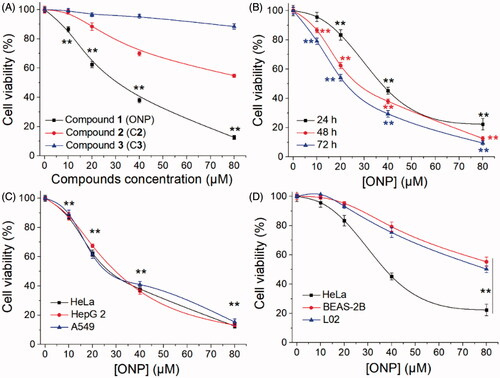
Figure 3. Killing HeLa cells by ONP primarily via inducing apoptosis. (A) Nuclear morphological changes after ONP treatment. HeLa cells were incubated for 24 h with 0, 10, 20, or 40 μM of ONP treatment, and the nuclei were stained by Hoechst 33342. Nuclear morphology changes then were observed under a fluorescence microscope. The bright filed pictures (top panel) and the fluorescence pictures (bottom panel) were imaged and acquired. Scale bars: 20 μm. Arrows refer to the condensed and irregular nuclei with bright fluorescence stained by Hoechst 33342 in (A). (B) Assessment of apoptosis by Annexin V-FITC/PI double staining assay. HeLa cells were treated with 0, 10, 20, or 40 μM of ONP treatment for 24 h, and the numbers of apoptotic cells were measured by the Annexin V-FITC/PI double staining assay. (C) Quantification of apoptotic cells (Q2 and Q4) from (B) by flow cytometry. (D) Activation of caspase 3 in HeLa cells by ONP. HeLa cells were incubated with 0, 10, 20, or 40 μM of ONP treatment for 24 h, and the caspase 3 activity in the cellular extracts was measured by a colorimetric assay. Data are expressed as mean ± S. E. of three experiments. **p < 0.01 versus the control groups.
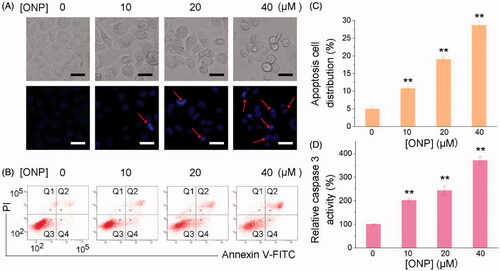
Figure 4. Induction of ROS accumulation in HeLa cells. Accumulation of ROS in HeLa cells by DCFH-DA staining (A) or DHE staining (C). HeLa cells were treated with 20 or 40 μM of ONP for 24 h, followed by incubation with the ROS probe DCFH-DA (10 μM) or superoxide probe DHE (10 μM) for 30 min. The bright-field (top panel) and the fluorescent-field (bottom panel) pictures from three independent experiments were imaged and acquired by an inverted fluorescence microscope. The fluorescence intensity in individual cells from (A) and (C) was quantified by ImageJ versus the control group and was shown in (B) and (D). **p < 0.01 versus the control groups. Scale bars: 20 μm.
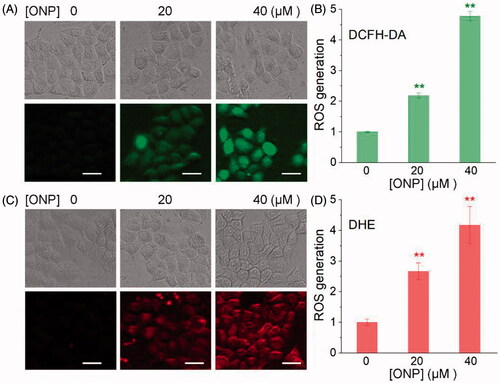
Figure 5. Inhibiting cellular TrxR activity by ONP. (A) TRFS-green-based live-cell imaging TrxR activity assay. HeLa cells were incubated with 0, 10, 20, or 40 μM of ONP or 40 μM C2 or C3 for 12 h. Cellular TrxR activity was assessed by TRFS-green. The fluorescence images were acquired by inverted fluorescence microscopy. (B) Fast-TRFS-based cell lysate TrxR activity assay. HeLa cell lysate (0.3 mg·mL−1) was incubated with NADPH (100 µM) for 5 min at 37 °C. ONP (0, 10, 20, or 40 µM) and blank sample (0.1% DMSO) were added to and the mixture was continued to incubate for 1 h. The probe Fast-TRFS (10 µM) and NADPH (100 µM) were added to initiate the enzymatic reduction of Fast-TRFS. The fluorescence change at 460 nm was recorded (λex = 345 nm) for 10 min on a fluorescent plate reader (Tecan Infinite M200), and the rate of fluorescence increase within the initial 5 min was calculated. The relative TrxR activity was expressed as the percentage of the DMSO-treated sample. Inhibition of intracellular TrxR activity by ONP in a concentration and time-dependent manner (C), and the difference of inhibition of cellular TrxR activity by ONP, C2, and C3 (D) were assayed by the Trx-mediated endpoint insulin reduction. After the HeLa cells were treated with varying concentrations of ONP, C2, and C3 for 12 or 24 h, the enzyme activity of TrxR in HeLa cells was determined by the Trx-mediated endpoint insulin reduction assay. Scale bars: 20 μm. Data are expressed as mean ± S. E. of three experiments. ** p < 0.01 versus the control group.
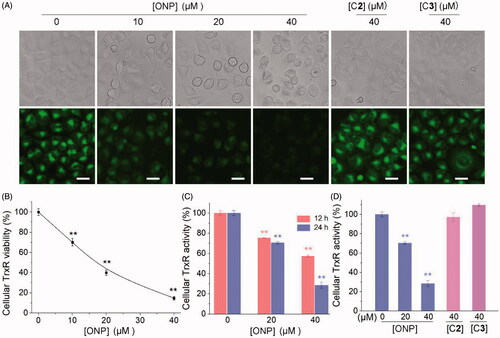
Figure 6. Evidence for the interaction site between ONP and TrxR. (A) ONP and C3 selectively inhibited pure TrxR. (The illustration is the structural difference between ONP and C3). (B) Varying concentrations of ONP showed the difference in activity inhibition of WT TrxR and U498C TrxR1. (The illustration exhibited the difference between WT TrxR and U498C TrxR1). (C) ONP at a concentration of 5 μM inhibited the activity of pure TrxR in a time-dependent manner. The enzyme activities in (A), (B), and (C) are all detected by the DTNB method. The NADPH pre-reduced enzyme was incubated with different concentrations of ONP or C3 for 1 h, and then the enzyme activity in the system was detected by the DTNB method. (D) Covalent docking for ONP with the C-terminal site 498 of the chain A of the mouse TrxR1. The docking experiment was conducted using the covalent docking protocol in the SchrödingerSuite 2015-1 program. The monomer of TrxR1 is represented by a cyan cartoon. The interacting residues in the ONP and active site are shown in orange and purple sticks. Data are expressed as mean ± S. E. of three experiments. **p < 0.01 versus the control groups.
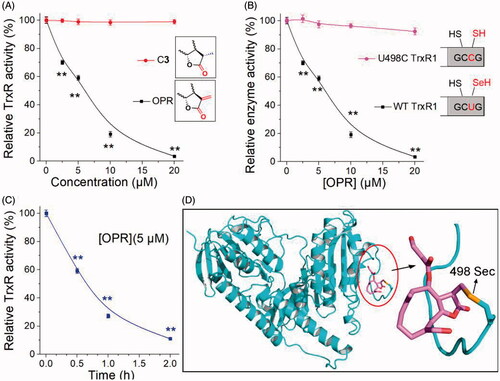
Figure 7. Contribution of targeting TrxR to ONP cytotoxicity. (A) The positive correlation between inhibition of HeLa cell viability by ONP and inhibition of intracellular TrxR activity by ONP. Different concentrations of ONP were incubated with HeLa cells for 24 h, and the intracellular TrxR activity was detected by the Trx-mediated endpoint insulin reduction assay. The HeLa cell survival rate under the same administration conditions was detected by the trypan blue exclusion staining method. (B) The difference in cytotoxicity of ONP towards the HeLa cell line knocked down TrxR1. ONP (20 and 40 μM) acted on HeLa-shNT and HeLa-shTrxR1 cells for 24 h, respectively, and the cell viability was detected by the trypan blue exclusion staining method (average of three independent experiments). (C) The difference in cytotoxicity of ONP to HEK 293T cell line overexpressing TrxR1. The survival rate of HEK-IRES and HEK-TrxR1 cells under the same experimental conditions as (B) was detected by the trypan blue exclusion staining method (average of three independent experiments). Data are expressed as mean ± S. E. of three experiments. **p < 0.01 versus the control groups.
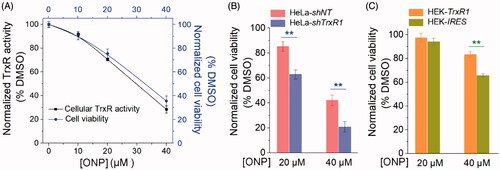
Figure 8. Revealing the mechanism of ONP isolated from the new genus Shangwua for targeting TrxR to induce oxidative stress-mediated apoptosis.