Figures & data
Figure 1. Virtual screening process to identify the best hit compound.
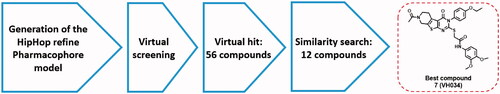
Figure 2. Representative TSPO ligands used as a training set to generate the pharmacophore model.
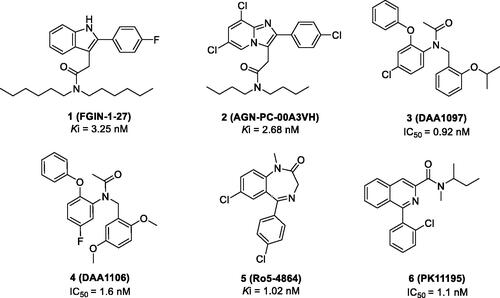
Figure 3. The ligand-based pharmacophore model mapping with FGIN-1–27 (1). (C atom, black; N atom, blue; O atom, red; F atom, cyan). The pharmacophore features are drawn as colour-coded spheres: H-bond acceptor, green; hydrophobic feature, light blue; and ring aromatic feature, blue.
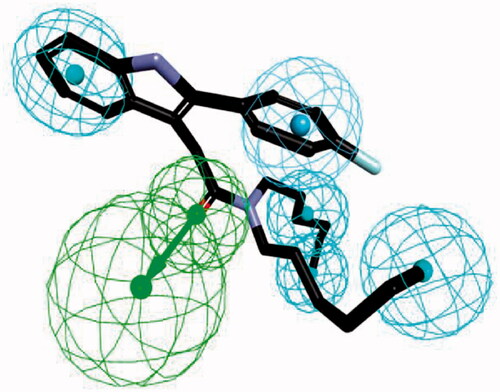
Table 1. In vitro cell-based assay results of 7 and 8.
Table 2. In vitro cell-based assay results of 9–20.
Figure 4. Recovery of Y-maze spontaneous alternations in an acute AD model by the treatment of compounds 7 or 14 (30 mg/kg daily, 6 days, i.p.) Each group was evaluated by comparing with the piracetam-treated group (30 mg/kg daily, 6 days, i.p.). Data are expressed as a mean ± SEM (n = 7 per group): *p < 0.05.
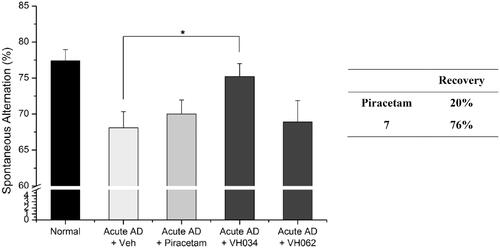
Figure 5. Recovery of Y-maze spontaneous alternations in transgenic (Tg; APPswe/PSEN1dE9 2x TG) AD model mice by the treatment of 7. Each group was evaluated by comparing with the piracetam-treated group (30 mg/kg daily, 1 month, PO). Data are expressed as a mean ± SEM (n = 7 per group): *p < 0.05.
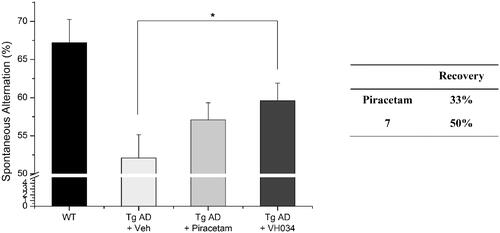
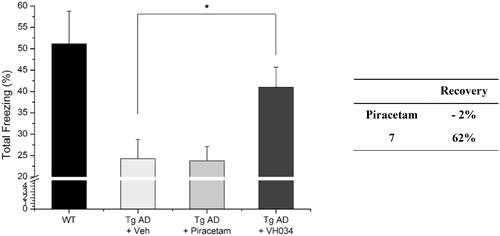
Figure 6. Contextual fear conditioning tests in wildtype and transgenic AD model mice. Each group was evaluated by comparing with the piracetam-treated group (30 mg/kg daily, 1 month, PO). Data are expressed as a mean ± SEM (n = 7 per group): *p < 0.05.
Scheme 1. Synthesis of 5,6,7,8-tetrahydropyrido[4',3':4,5]thieno[2,3-d]pyrimidin-4(3H)-one derivatives 7, 14, and 27–57. Reagents and conditions: (a) ethyl 2-cyanoacetate, Sulphur, Et3N, EtOH, reflux, 4 h, 96–100%, (b) 1,1'-thiocarbonylbis(pyridin-2(1H)-one), THF, reflux, 4 h, 80–86%, (c) substituted aniline, EtOH, reflux, 12 h, 84–93%, (d) (i) 10% NaOH/MeOH (1:3), reflux 3 h, (ii) 2 N HCl, 93–98%, (e) 2-bromo-N-substitued acetamide 26, Et3N, MeCN, reflux, 5 h, 33–98%.
![Scheme 1. Synthesis of 5,6,7,8-tetrahydropyrido[4',3':4,5]thieno[2,3-d]pyrimidin-4(3H)-one derivatives 7, 14, and 27–57. Reagents and conditions: (a) ethyl 2-cyanoacetate, Sulphur, Et3N, EtOH, reflux, 4 h, 96–100%, (b) 1,1'-thiocarbonylbis(pyridin-2(1H)-one), THF, reflux, 4 h, 80–86%, (c) substituted aniline, EtOH, reflux, 12 h, 84–93%, (d) (i) 10% NaOH/MeOH (1:3), reflux 3 h, (ii) 2 N HCl, 93–98%, (e) 2-bromo-N-substitued acetamide 26, Et3N, MeCN, reflux, 5 h, 33–98%.](/cms/asset/e1693b7c-4b9b-4f3c-8f07-961d70a9ad36/ienz_a_1900158_sch0001_b.jpg)
Scheme 2. Synthesis of 5,6,7,8-tetrahydropyrido[4',3':4,5]thieno[2,3-d]pyrimidin-4(3H)-one derivatives 58–62. Reagents and conditions: (a) substituted amine, EtOH, reflux, 12 h, 57–99%, (b) (i) 10% NaOH/MeOH (1:3), reflux 3 h, (ii) 2 N HCl, 56–96%, (c) 2-bromo-N-(3,4-dimethoxyphenyl)acetamide 26, Et3N, MeCN, reflux, 5 h, 50–90%.
![Scheme 2. Synthesis of 5,6,7,8-tetrahydropyrido[4',3':4,5]thieno[2,3-d]pyrimidin-4(3H)-one derivatives 58–62. Reagents and conditions: (a) substituted amine, EtOH, reflux, 12 h, 57–99%, (b) (i) 10% NaOH/MeOH (1:3), reflux 3 h, (ii) 2 N HCl, 56–96%, (c) 2-bromo-N-(3,4-dimethoxyphenyl)acetamide 26, Et3N, MeCN, reflux, 5 h, 50–90%.](/cms/asset/25c7fbb6-debd-470f-8cf1-cbd16b161fdf/ienz_a_1900158_sch0002_b.jpg)
Table 3. In vitro assay results of compounds 27–47.
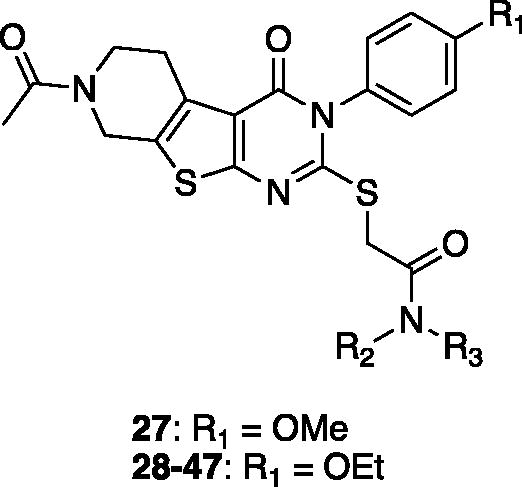
Table 4. In vitro assay results of compounds 48–57.
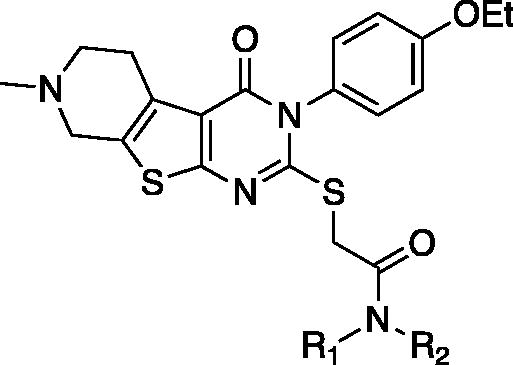
Table 5. In vitro assay results of compounds 58–62.
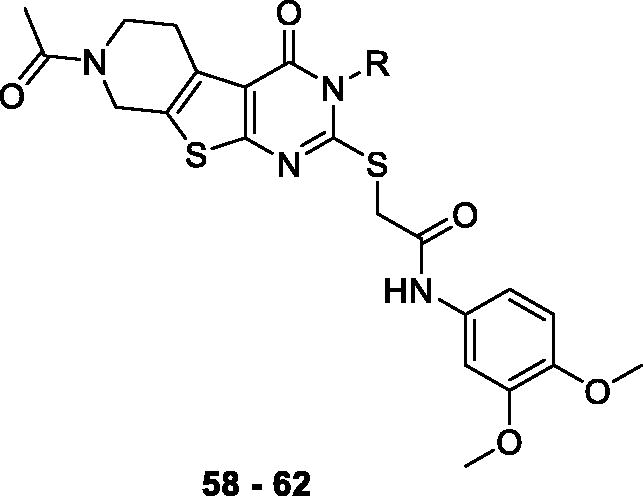
Table 6. CYP450, hERG liability, and human liver microsomal stability profiles of the selected compounds.
Figure 7. Recovery of Y-maze spontaneous alternations in acute AD model mice by treating each compound. Each group was evaluated by comparing with the piracetam-treated group (30 mg/kg daily, 6 days, i.p.). Data are expressed as a mean ± SEM (n = 7 per group): *p < 0.05.
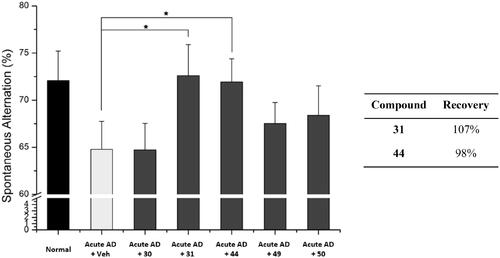
Table 7. Pharmacokinetic parameters (mean ± SD) of compounds 31 and 44 after intravenous (n = 3) and oral (n = 3) administration (10 mg/kg) to SD male rats.a
Table 8. TSPO binding affinity.a
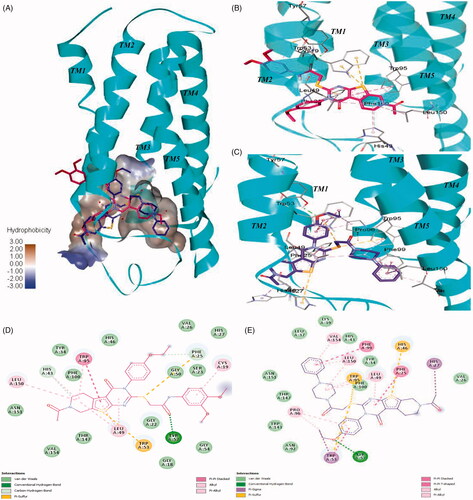
Figure 8. Interactions of 7 and compound 44 with the human TSPO homology model. (A) Surface depiction of the TSPO binding site with the binding orientation overlapped with 7 (red stick) and compound 44 (blue stick). Detailed view of the interactions between 7 (B) and compound 44 (C) with the human TSPO. TSPO is represented with cyan helices and the interacting amino acids are depicted with grey sticks. Corresponding 2D interactions of 7 (D) and compound 44 (E).