Figures & data
Figure 1. A multiple sequence alignment among BpHldC and its homologs. The predicted d-glycero-β-d-manno-heptose-1-phosphate (βH1P) binding sites were based on the docking experiment obtained after selecting 12 BpHldC homologs. The predicted substrate-binding motifs, TNG, NSD, KG, EXTP, and KGG, are indicated and the red characters represent the residues that took part in the interaction with βH1P. In the case of the EXTP motif, X represents any amino acids. In the docking result, the X residue is Lys100. Interestingly, the backbone oxygen was involved in the interaction with βH1P.
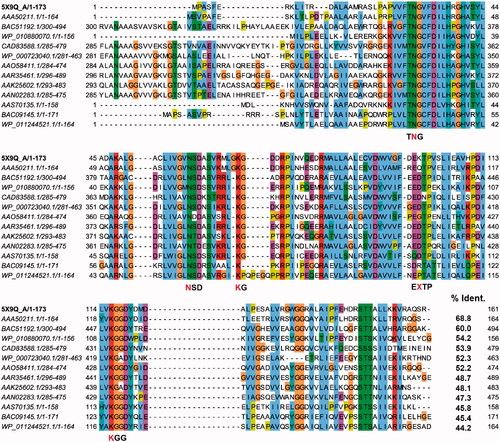
Figure 2. Predicted docking modes of d-glycero-β-d-manno-heptose-1-phosphate (βH1P) and βG1P in the catalytic site of BpHldC. The presumed substrate binding sites were obtained based on the X-ray crystal structure of three homologues complexed with their substrates (PDB ID: 1H1T, 1N1D, 3HL4). (a) The superimposed view of βH1P and βG1P docked on the active site (grey, βH1P; green, βG1P). The substrates and functionally important residues Asn 30, Asn 59, Lyn 69, Lys100, and Lys 116 were depicted with a stick model. All residues belong to putative substrate-binding motifs (). In the case of Lys100, the backbone oxygen participates in the interaction. In addition, 2D schematic representations of the docked (b) βH1P and (c) βG1P with BpHldC were drawn. Figures were created with Maestro v11.5.011 and ChemDoodle v10.1.0 (iChemLabsTM). The blue line represents ion interactions and the pink arrows represent the hydrogen bonds. According to the induced-fit docking results, the glide g-scores of substrates in the binding site pocket were –6.68 for βH1P and –6.59 for βG1P.
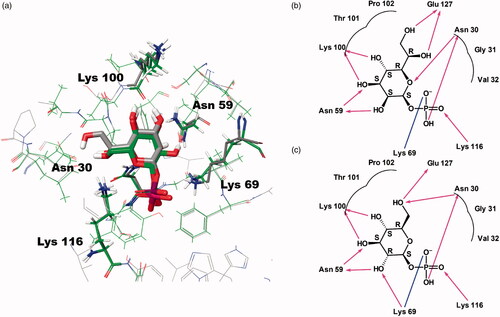
Figure 3. The allosteric activities of BpHldC. The enzyme activities with (a) various concentrations of ATP with 1 mM βG1P and (b) various concentrations of βG1P in the presence of 0.5 mM ATP. The graphs indicated that the maximum velocities were obtained at 0.5 mM ATP in the presence of 1 mM βG1P and 1 mM βG1P in the presence of 0.5 mM ATP, respectively. Each dot is expressed as the mean ± standard error of the mean (n = 3).
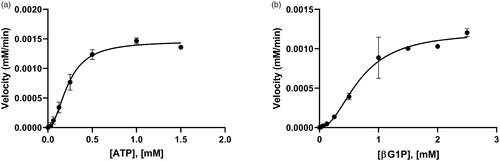
Figure 4. Dose-dependent inhibitory curves for the inhibition of BpHldC by ChemBridge (a) 7929959, (b) 7933420, and (c) 7991890. Each data point represents the effect of each inhibitory compound against BpHldC compared to the control. The %Reactivities are plotted against the log-concentration of inhibitory compounds. Each dot is expressed as the mean ± standard error of the mean (n = 3).
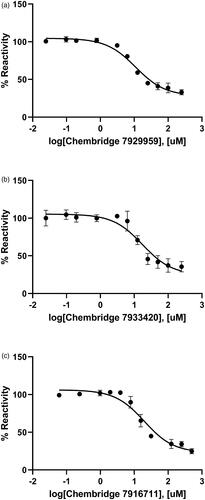
Figure 5. Inhibitory enzyme kinetics of BpHldC with ChemBridge 7929959 (CB7929959) (a, b), ChemBridge 7933420 (CB7933420) (c, d), and ChemBridge 7991890 (CB7991890) (e, f). (a, c, e) Steady-state kinetics with inhibitors regarding ATP at a fixed concentration of 1 mM βG1P. (b, d, f) Inhibition of BpHldC by compounds at varying βG1P concentrations with a constant concentration of 0.5 mM ATP is presented. Compounds were treated to each point with six concentrations (0, 2.5, 5, 10, 20, and 40 µM). Each dot is expressed as the mean ± standard error of the mean (n = 3).
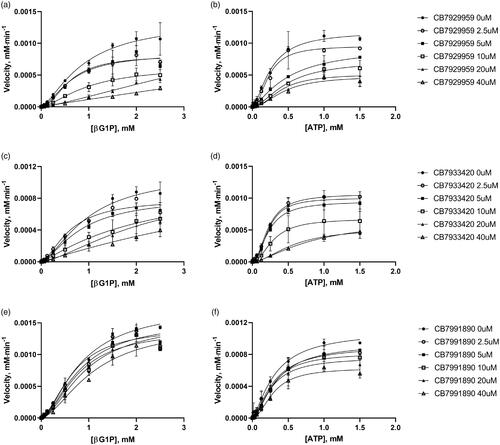
Table 1. Inhibitory properties of compounds with BpHldCa.
Figure 6. Predicted docking modes of ChemBridge compounds in the catalytic site of BpHldC. (a) The docking pose of ChemBridge 7929959 (orange), 7933420 (green), and 7991890 (grey) were depicted on the electrostatic surface potential of BpHldC (red, negative; blue, positive; white, uncharged). (b) The superimposed view of ChemBridge compounds docked on the active site. Functionally important residues Asn 30, Lys69, Lys100, Lyn116, and Phe143 were depicted with a stick model according the docking mode of ChemBridge 7929959. In addition, 2D schematic representations of the docked ChemBridge compounds with BpHldC were drawn. (c) ChemBridge 7929959, (d) ChemBridge 7933420, and (e) ChemBridge 7991890. Figures were created with Maestro v11.5.011 and ChemDoodle v10.1.0 (iChemLabsTM). The pink arrows represent the hydrogen bonds. The green line represents the π–π interaction and the dotted line represents the π–cation interaction. Comparison with other substrate-bound crystal structures of BpHldC homologues revealed that Phe143 former locates in the nucleotide binding cavity and Lys69 interacts with the phosphate moiety of nucleotide. The residues in the highly conserved substrate binding motifs () are drawn with curved lines.
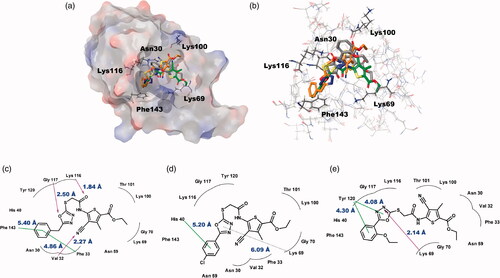
Figure 7. The comparison of reactivities of BpHldC with ChemBridge 7929959 and 7570508. The malachite assay was performed with 0.5 mM ATP and 1 mM βG1P. The observed absorbance could be considered as the reactivity of BpHldC. Compared to the control with DMSO, the reactivity of BpHldC with ChemBridge 7929959 fell meaningfully. However, the reactivity of BpHldC with ChemBridge 7570508 was almost not changed.
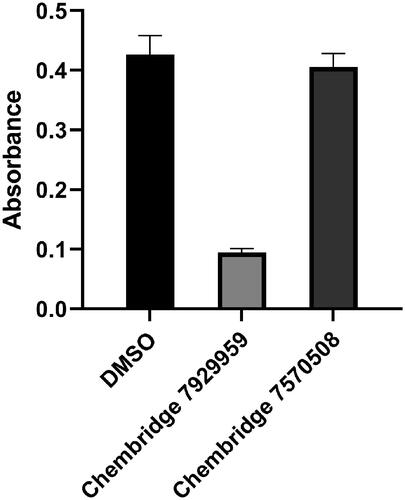
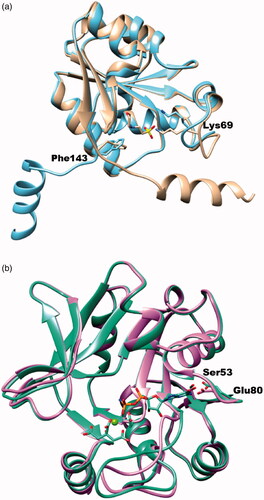
Figure 8. The superimposed ribbon diagrams of ligand-free and ligand-bound X-ray crystal structures of BpHldC and YpHddC. (a) The native (sky blue) and MES bound (tan) forms of BpHldC were drawn. (b) The native (orchid) and GMPPN (spring green) bound forms of YpHddC were drawn. A magnesium ion and a citrate molecules are also displayed. In both figures, catalytically important residues Lys69 and Phe143 were drawn with a stick model and labelled.