
Figures & data
Figure 1. Commercial AChEIs approved for the treatment of AD.
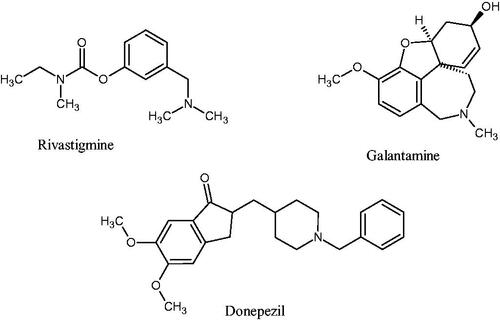
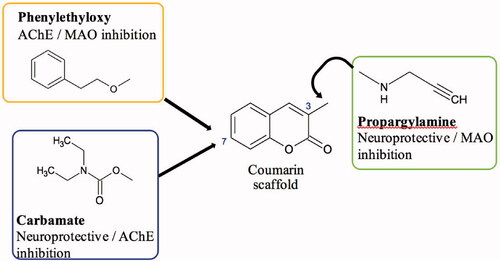
Figure 2. Design strategy of the new coumarin derivatives in this study.
Scheme 1. Synthesis pathway of the test compounds. Reagents and conditions: (a) Sodium propionate, propionic anhydride, piperidine, reflux, 6 h; (b) 2-bromoethylbenzene, NaH, acetonitrile, MW @ 150 W, 80 °C, 5 h; (c) diethyl carbamoyl chloride, K2CO3, acetonitrile, MW @ 150 W, 80 °C, 2.5 h; (d) N-bromosuccinimide, benzoyl peroxide, CCl4, stir at room temperature, 7 h; (e) N-bromosuccinimide, benzoyl peroxide, CCl4, reflux, 15 h; (f) propargylamine, K2CO3, dry THF, stir for 48 h.
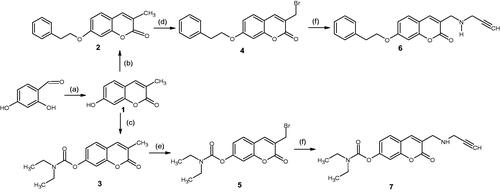
Table 1. Optimisation of reaction conditions using microwave-assisted methods for compounds 2 and 3.
Table 2. In vitro biological activities of the synthesised and reference compounds.
Figure 3. (a) Diagrammatic representation of compound 1’s lack of binding interactions with amino acids in MAO-A’s active site. (b) 3D docking simulation showing 1 indicated in pink within the MAO-A active site.
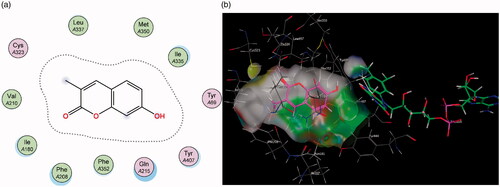
Figure 4. (a) 2D representation showing the 7-phenylethyl derivative 2’s orientation in MAO-A’s substrate cavity. (b) 3D docking simulation showing 2 indicated in pink within the MAO-A active site.
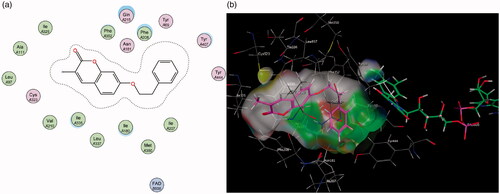
Figure 5. (a) 2D interaction map showing compound 7’s orientation and binding in MAO-A’s substrate cavity. (b) 3D docking simulation showing 2 indicated in pink within the MAO-A active site.
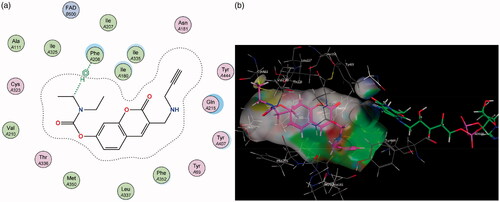
Figure 6. Diagrammatic representation showing binding interactions of the (a) 7-phenylethyloxy compounds (represented by 2) and (b) 7-carbamate compounds (represented by 5) when docked with MAO-B. This compound’s lack of π–H interaction with Ile 199 may explain its lower activity.
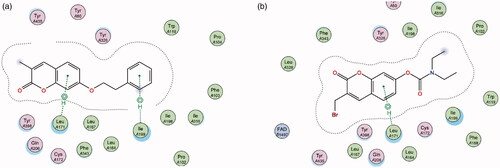
Figure 7. (a) 2D interaction map showing compound 7’s orientation and π–H binding with FAD and Tyr 398 in MAO-B’s substrate cavity. (b) 3D docking simulation showing 7 indicated in pink within the MAO-B active site.
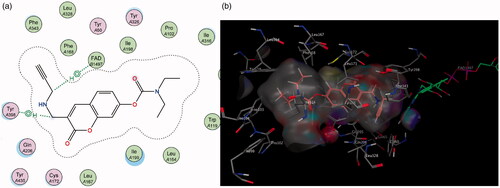
Figure 8. Time-dependent inhibition of the recombinant human MAO-B catalysed oxidation of kynuramine by selegiline, 6 and 7. The enzyme was preincubated for various periods of time (0–60 min, x-axis). Data are expressed as the mean RFU (relative fluorescent units) ± SEM of three independent experiments.
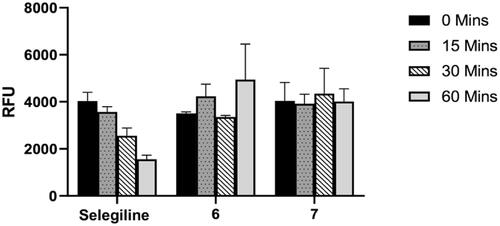
Figure 9. (a) Diagrammatic representation of compound 3’s lack of binding interactions with AChE. (b) 3-Dimensional representation of docking simulation (bottom) with 3 indicated in pink and AChE’s active site’s amino acids indicated in green. The carbamate portion of the molecule towards the left does not participate in any interactions and lies towards the entrance of the active site.
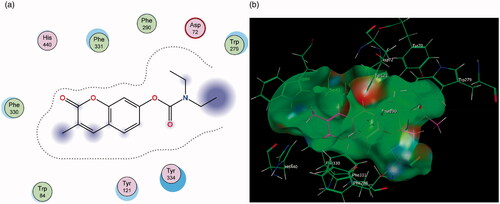
Figure 10. (a) Diagrammatic representation of compound 4’s binding interactions with Trp 84 and Phe 330 in the CAS of AChE. (b) 3-Dimensional representation of docking simulation (bottom) with 4 indicated in pink and AChE’s active site’s amino acids indicated in green.
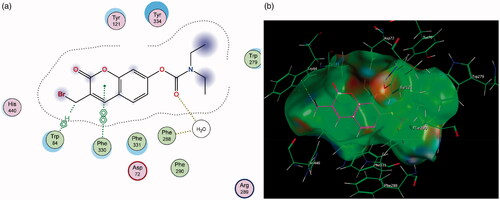
Figure 11. (a) Diagrammatic representation of 3-propargylamine derivatives’ lack of binding interactions with AChE. The π–π stacking with Phe 330 is diminished. (b) 3-Dimensional representation of docking simulation (bottom) with 6 indicated in pink and AChE’s active site’s amino acids indicated in green. The coumarin portion now points away from the CAS and does not partake in significant interactions within the active site.
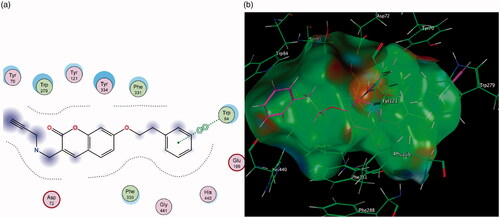
Figure 12. Percentage of cells viable following incubation with test compounds relative to a control of untreated cells. Each bar represents the mean percentage survival and SD (where n = 3, three fields per repeat). The data was subjected to an ANOVA statistical analysis and significance was defined as [*p < 0.05 and ****p < 0.0001] when comparing the compounds’ means to the negative control.
![Figure 12. Percentage of cells viable following incubation with test compounds relative to a control of untreated cells. Each bar represents the mean percentage survival and SD (where n = 3, three fields per repeat). The data was subjected to an ANOVA statistical analysis and significance was defined as [*p < 0.05 and ****p < 0.0001] when comparing the compounds’ means to the negative control.](/cms/asset/03a23c2e-90dc-4459-a5ce-d30ab3765a94/ienz_a_1913137_f0012_c.jpg)
Figure 13. Bar graph comparing the effect of the test compounds (10 µM) on MPP+-induced toxicity in SH-SY5Y cells. The cell viability count of the untreated control was defined as 100%. Error bars represent the standard deviation of the mean data. Statistical significance (*p < 0.05) when compared to the MPP+ only treated cells (purple bar) is indicated on the graph.
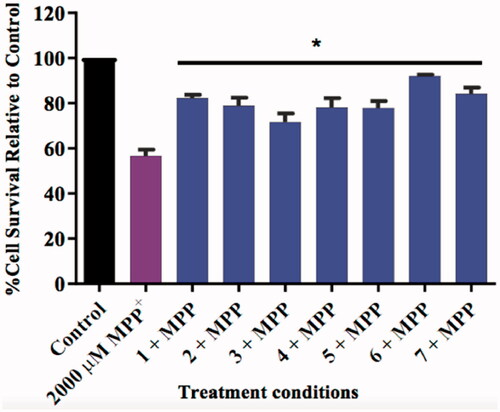
Figure 14. The simulated oral bioavailability of compounds 6 and 7 represented as a radar chart.
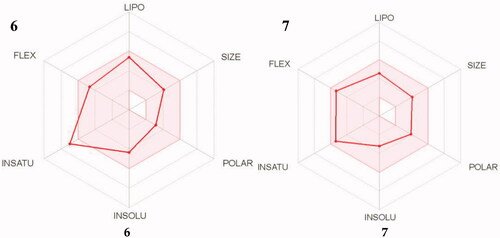
Table 3. In silico drug-likeness properties of compounds 6 and 7