Figures & data
Scheme 1. Reagents and conditions: (i) DMF-DMA, 100 °C, 1 h; (ii) conc HCl/50% cyanamide water solution, 100 °C, 0.5 h; (iii) n-butanol, NaOH, M.W. (40 min, 160 °C); (iv) MeCN, K2CO3, DMEDA, CuI, 100 °C, 8–24 h.
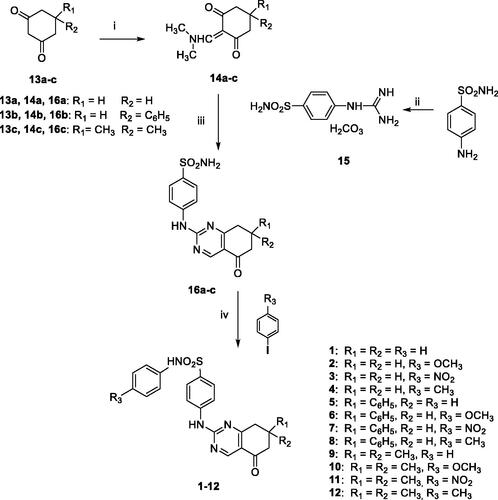
Table 1. Inhibition of hCA isoforms I, II, IV, and IX with tetrahydroquinazoline derivatives 1–12, 16a–c, and AAZ as the reference standard by a stopped-flow CO2 hydrase assay.
Table 2. Inhibition of hCA isoforms I, II, IV, and IX with tetrahydroquinazoline (1–4) tetrahydroindazole (VIa–d)Citation16 and secondary sulphonamides.
Chart 1. Structures of celecoxib (CLX), valdecoxib (VLX), acetazolamide (AAZ); structures of previously described (I-VI) and newly synthesized (1–12) CAIs.]
![Chart 1. Structures of celecoxib (CLX), valdecoxib (VLX), acetazolamide (AAZ); structures of previously described (I-VI) and newly synthesized (1–12) CAIs.]](/cms/asset/7188df13-76a4-46d8-8939-9ca36355eba0/ienz_a_1956913_f0005_b.jpg)
Figure 1. 3/hCA IX theoretical complex (PDB 5FL4) computed by docking calculations. The protein is shaded in salmon and all the critical residues are labelled. The ligand is shown in pink colour while the H-bonds are shown in black dashed lines.
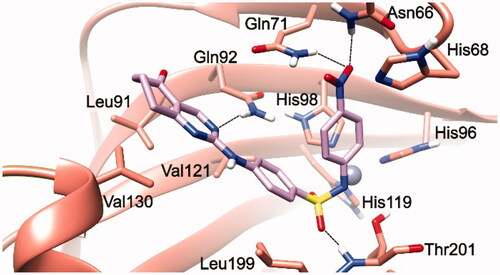
Figure 2. (S)-5/hCA IX (A) and (R)-5/hCA IX theoretical complexes (PDB 5FL4) computed by docking calculations. The protein is shaded in salmon and all the critical residues are labelled. The ligand is shown in yellow and cyan, respectively, while the H-bonds are shown in black dashed lines.
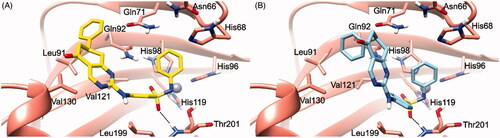
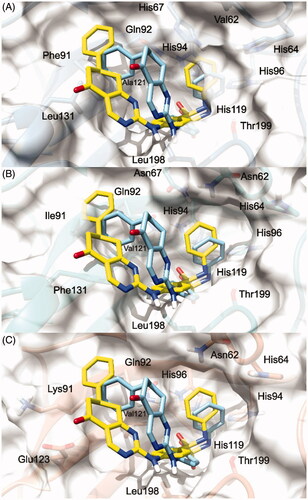
Figure 3. 3/hCA IX theoretical binding pose translated into hCA I (PDB 6EVR, A), hCA II (PDB 3K34, B), and hCA IV (PDB 5JN9, C) structures. The proteins are shown in blue, sea-green, and coral ribbons and sticks, respectively, with their molecular surface shaded in white. The ligand is depicted in pink.
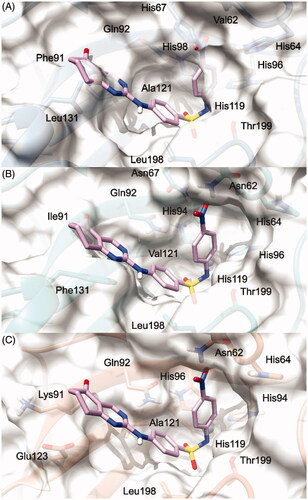
Figure 4. (S)-5 and (R)-5/hCA IX theoretical binding pose translated into hCA I (PDB 6EVR, A), hCA II (PDB 3K34, B), and hCA IV (PDB 5JN9, C) structures. The proteins are shown in blue, sea-green, and coral ribbons and sticks, respectively, with their molecular surface shaded in white. (S)-5 and (R)-5 are depicted in yellow and cyan sticks. All the pictures were rendered using UCSF chimera molecular visualisation softwareCitation40.