Figures & data
Figure 1. SL0101 binding to RSK2 is time dependent. (A) Simplified schematic of RSK2 kinase domains and their activation sites and functions, adapted fromCitation39. (B) Chemical composition of SL0101 and analogues. (C) Recombinant, purified RSK1, RSK2, and RSK2 NTKD visualised with Coomassie Blue. (D) Schematic of FRET assay (upper). Kinase, Eu-labelled anti-His antibody, SL0101, and tracer are mixed, incubated for 5 min and fluorescence measured, or a kinase/antibody/SL0101 mixture incubated for 2 h before tracer addition and fluorescence determined. Amount of tracer bound to RSK2 relative to vehicle control (lower) (N = 5 in quadruplicate for 5 min incubation and n = 9 in quadruplicate for 2 h pre-incubation). (E) Relative kinase activity in ELISA-based assay of RSK2 pre-incubated with SL0101 for 5 min or 2 h (N = 3 each in triplicate). (F) Relative tracer bound to RSK2 incubated with inhibitor 1b for 5 min or 2 h (N = 2 in quadruplicate or 4 in quadruplicate, respectively). Data are plotted as mean and error bars represent SD.
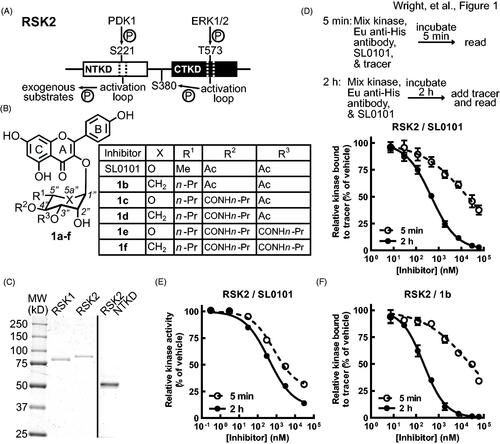
Figure 2. Specificity of SL0101 for RSK1/2 cannot be explained by SL0101-interacting residues. (A) Alignment of the RSK family NTKD catalytic core. Numbering and highlighting are relative to RSK2. Black = non-identical amino acids. Yellow = amino acids composing the SL0101-binding pocket. Black outline = residues discussed. (B) Crystal structure of RSK2NTKD-SL0101 (PDB Accession 3UBD) showing SL0101 (white) in its binding pocket (red surface). (C,D) Position of the P-loop relative to SL0101 in RSK2NTKD-SL0101. Distance measured between centre of Phe79 side chain phenol and A ring of SL0101, and angle measured between plane of A ring of SL0101 and Phe79. (E) Phe79 showing hydrogen bonding (red) to nearby residue side chains (left) and computational mutation of Phe79 to Tyr with additional hydrogen bonds to Leu150 and Leu200 (right). (F) Leu155 showing hydrogen bonding (red) and hydrophobic interactions (grey) to nearby residue side chains (left); computational mutation of Leu155 to Val with additional hydrogen bonds to Arg158 and Thr157 and loss of hydrophobic interaction with Phe79 (right). (G) Ala51 positioned in the middle β strand of the de novo β sheet formed in RSK2NTKD-SL0101 (left). Computational mutations to Ser (second to left), Asp (second to right), and to Pro (right) showing hydrogen bonding (red) or clashes between van der Waals radii (yellow). (H) Ile88 - Ser91 and Ala93 - His95 in RSK2NTKD-SL0101 in an unstructured region (red) clustered away from the SL0101 (white) binding pocket.
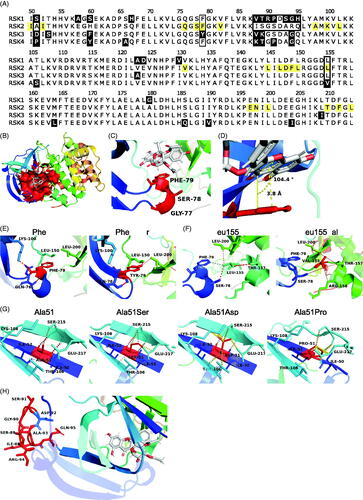
Table 1. Binding characteristics of SL0101 and selected analogues.
Figure 3. SL0101 binds differentially to RSK1 and isolated RSKNTKD compared to RSK2. (A,B) Amount of tracer bound to RSK1 or RSK2NTKD after 5 min or 2 h incubation with SL0101 relative to vehicle control (N = 4 in quadruplicate each). (C) Amount of tracer bound to isolated RSK2 after 5 min or 2 h incubation with inhibitor 1c relative to vehicle control (N = 5 and 3, respectively, each in quadruplicate). Data are plotted as mean and error bars represent SD.
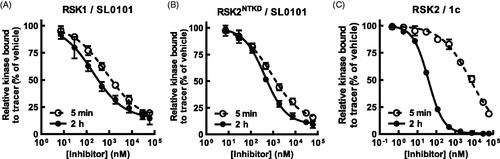
Figure 4. SL0101 analogues have improved affinity for RSK2 and dissociate more slowly. (A) Amount of tracer bound to RSK2 after 2 h pre-incubation with SL0101 analogues (N = at least 3 each in quadruplicate); Data are plotted as mean and error bars represent SD. (B) Relative off-rate of SL0101 analogues (N = at least 3 each in quadruplicate). Data are plotted as IC50 and error bars represent SE of the IC50. Change in IC50 over time is plotted as log-log linear.
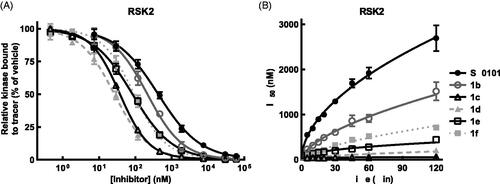
Figure 5. SL0101 and analogues interact differentially with RSK2 compared to RSK1. (A) Relative off-rate (change in IC50 after 2 h pre-incubation, N = 6 in quadruplicate) and on-rate (change in IC50 after 5 min incubation, N = 3 in quadruplicate) between SL0101 and RSK2, (B) inhibitor 1c and RSK2 (N = 5 and 2, respectively, each in quadruplicate), (C) SL0101 and RSK1 (N = 4 in quadruplicate each), or (D) inhibitor 1c and RSK1 (N = 4 and 2, respectively, each in quadruplicate). Data are plotted as IC50 with error bars representing SE of the IC50. Change in IC50 over time is fit as log-log-linear.
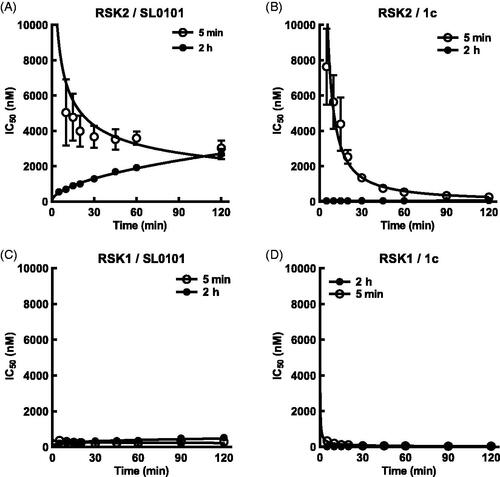
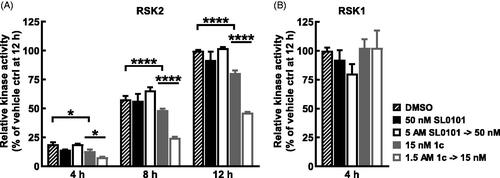
Figure 6. Long term inhibition of RSK2 compared to RSK1 with inhibitor 1c. (A,B) RSK2 or RSK1 were pre-incubated 2 h with SL0101, inhibitor 1c, or vehicle at the assay concentration shown (control) or 100X assay concentration and then diluted with kinase buffer (dilution). After dilution, ATP was added and the reaction proceeded for the times indicated, then the reaction was stopped with EDTA and the amount of phosphorylated substrate was measured by ELISA. RSK2 activity is relative to vehicle control at 12 h and relative RSK1 activity is relative to vehicle at 4 h. (N = 2 in duplicate each, 2-way ANOVA with Fisher’s Uncorrected LSD for multiple comparisons between control and dilution for each timepoint, p-values: * < 0.01, **** < 10−5). Data are plotted as mean and error bars represent SD.