Figures & data
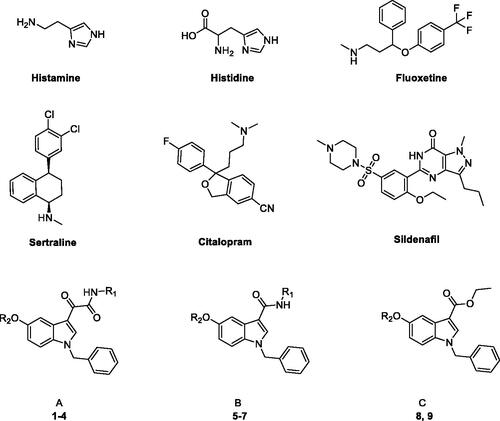
Figure 1. Structures of known and novel indole-based CAAs.
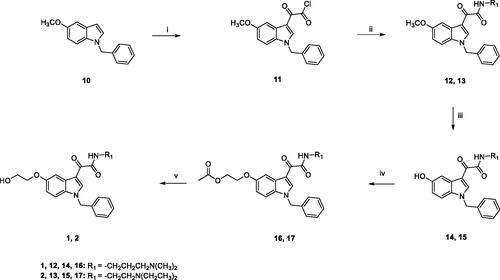
Scheme 1. Reagents and conditions: (i) anhydrous Et2O, oxalyl chloride, room temperature, 2h; (ii) anhydrous toluene, N,N-dimethyl-1,3-propylenediamine (for 12) or N,N-diethylethylenediamine (for 13), NEt3, room temperature, overnight; iii) a) anhydrous DCM, BBr3, -10 °C, 30 min.; (b) room temperature, overnight; (iv) acetone, Cs2CO3, 2-bromoethylacetate, reflux, overnight; (v) 1,4-dioxane, 1M NaOH, room temperature, 5h.
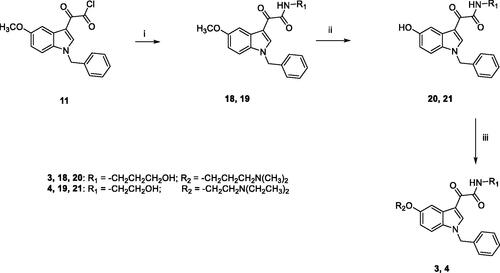
Scheme 2. Reagents and conditions: (i) 1,4-dioxane, 3-amino-1-propanol (for 18) or ethanolamine (for 19), room temperature, 3 h; (ii) (a) anhydrous DCM, BBr3, −10 °C, 30 min.; (b) room temperature, overnight; (iii) anhydrous DMF, Cs2CO3, 3-dimethylamino-1-propylchloride hydrochloride (for 3) or 2-chloro-N,N-diethylethylamine hydrochloride (for 4), 60 °C, 5h.
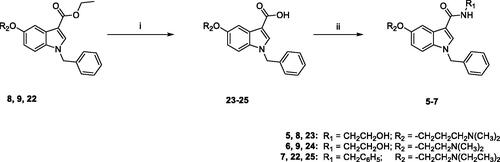
Scheme 3. Reagents and conditions: (i) MeOH/H2O, LiOH H2O, 80 °C, overnight; (ii) anhydrous DMF, TBTU, DIPEA, ethanolamine (for 5 and 6) or benzylamine (for 7), room temperature, overnight.
Scheme 4. Reagents and conditions: (i) abs. EtOH, conc. H2SO4, 80 °C, 20 h; (ii) (a) NaH, dry DMF, 0 °C, 30 min.; (b) BzBr, room temperature, 5 h; (iii) (a) anhydrous DCM, BBr3, -10 °C, 30 min.; (b) room temperature, overnight; (iv) anhydrous DMF, Cs2CO3, 3-dimethylamino-1-propylchloride hydrochloride (for 8) or 2-chloro-N,N-dimethylethylamine hydrochloride (for 9) or 2-chloro-N,N-diethylethylamine hydrochloride (for 22) or 60 °C, 5h.
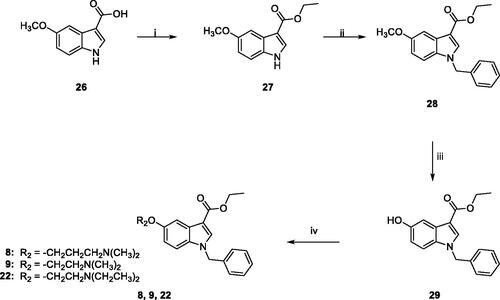
Table 1. CA activation of isoforms hCA I, II, VA, and VII with compounds 1–9, by a stopped-flow CO2 hydrase assay. 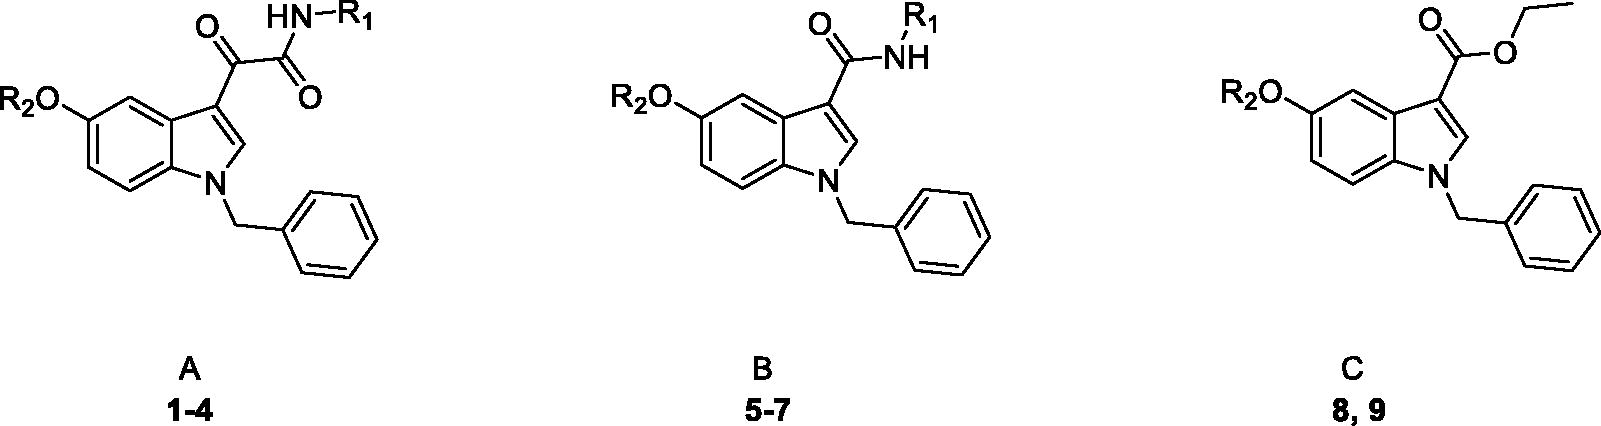
Figure 2. The best binding pose of 7 before (A) and after (B) the proton shuttling step in the hCA VII active site (PDB ID 3MDZ). The ligand is represented as orange (A) or yellow (B) sticks, while the protein structure is depicted in sea-green ribbons and sticks. Interacting residues are labelled. The Zn2+ ion is represented as a violet sphere. H-bonds are represented with the red dashed lines.
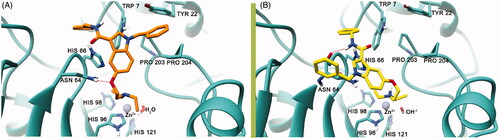
Figure 3. Binding poses calculated for compound 7 (orange and yellow) rigidly translated into the hCA I structure (PDB ID 6EVR, pink surface, A) and hCA II structure (PDB ID 3K34, green surface, B). All the pictures were rendered using UCSF Chimaera softwareCitation61.
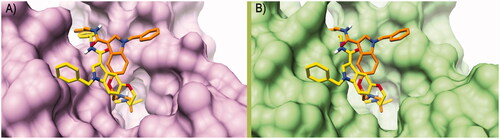
Table 2. Calculated physicochemical and pharmacokinetic properties of 7.
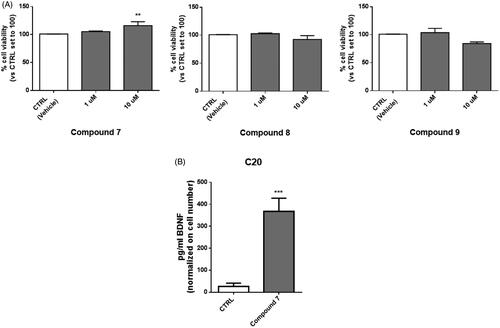
Figure 4. Treatment with compound 7 increases the level of BDNF released from human microglial cells. (A) C20 cells were exposed for 24 h at different concentrations of compounds 7, 8 and 9. Then the medium was replaced, and an MTS assay was performed to test cell viability. Results are reported as the percentage of the control group, treated with vehicle (DMSO). Data are represented as means ± SEMs of three independent experiments. The significance of the differences was determined by one-way ANOVA, which was followed by Bonferroni’s post-test: ** p < 0.01 vs. CTRL. B) The supernatant derived from C20 cells treated with 10 μM of compound 7 was collected and used for BDNF quantification by ELISA assay. Levels of BDNF (pg/ml) were then normalised on crystal violet absorbance. Data are represented as means ± SEMs of three independent experiments and the significance of the differences was determined by Student’s t-test analysis.