
Figures & data
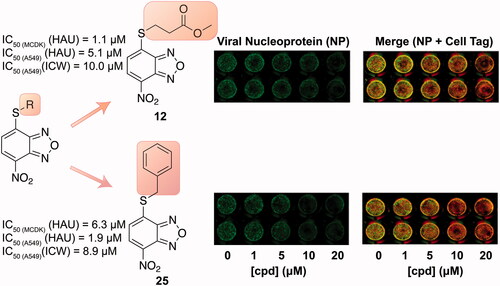
Figure 1. Most representative commercially available anti-IV drugs.
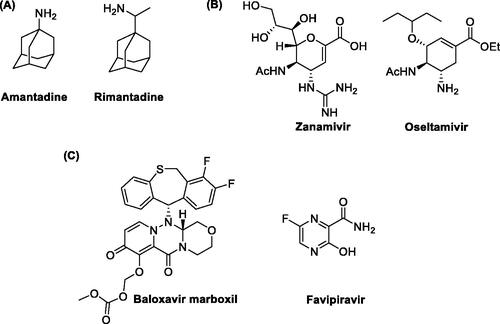
Figure 2. Most relevant benzoxadiazole derivatives (A–D) previously reported as anti-IV A agentsCitation24,Citation25.
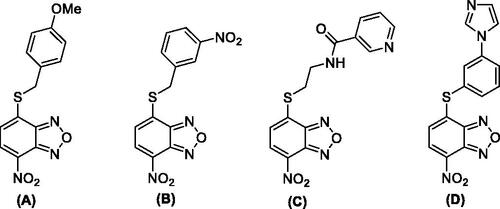
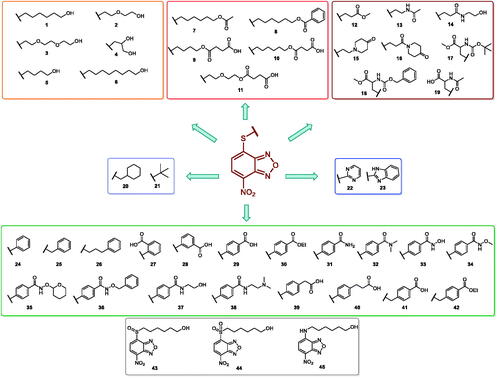
Figure 3. Structures of the compounds (1–45) evaluated in the study.
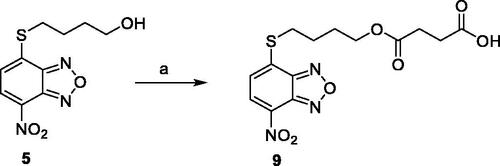
Scheme 1. Compound 9 preparation. Reagents and conditions: (a) succinic anhydride, DMAP, dry DCM, reflux.
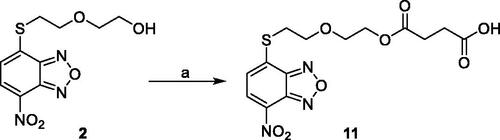
Scheme 2. Reagents and conditions: (a) succinic anhydride, DMAP, dry DCM, reflux.
Scheme 3. Preparation of compounds 19, 22, and 23. Reagents and conditions: (a) appropriate thiol (R-SH), pyridine, EtOH:H2O (0.3:1 v/v), rt.
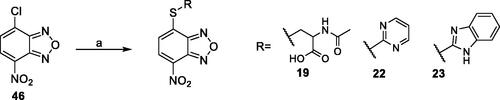
Table 1. Antiviral activity and cytotoxicity of NBD derivatives 1–45. 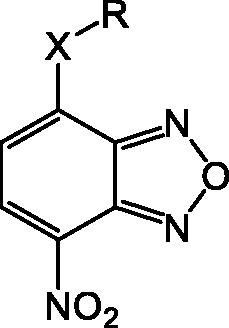
Figure 4. ICW assay on A549 cells infected with PR8 and treated with NBD derivatives 12, 17 and 25 (concentration range 1–20 μM). Left panel: The integrity of cell monolayer was revealed by Cell Tag on the 680 nm channel (red); viral NP expression on the 800 nm channel (green); merged images show the overlapping between viral protein and infected cells (yellow). Right panel. Fluorescence intensities determined by the Odyssey software and the ratios betwen NP and Cell Tag signal were calculated and averaged for duplicate wells. The values are shown as a function of compounds concentration. Error bars indicate s. d. The percentage (%) of fluorescence intensity was calculated respect to untreated infected cells (considered as 100%).
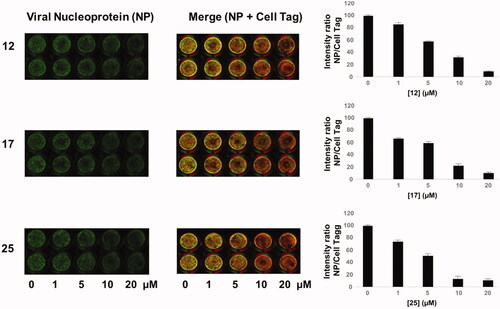
Table 2. Antiviral activity and selectivity of compounds 12, 17, and 25 in A549 cells as determined by both HAU and ICW assays.