Figures & data
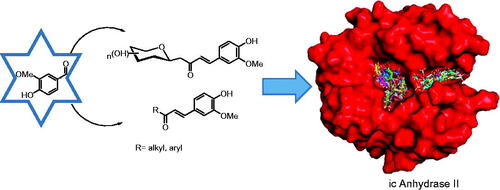
Table 1. Synthesis of vanillin enones 1–7.
Scheme 1. Preparation of vanillin enones 1–7 discussed in the paper
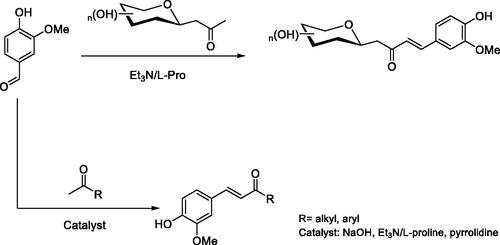
Figure 1. Structure of compounds 1–7.
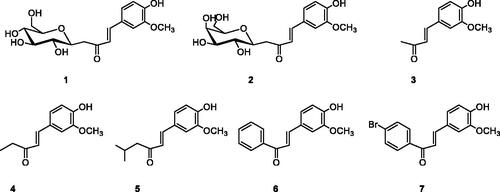
Table 2. Inhibition of hCA I, II, IX, XII with vanillin enones 1–7.Table Footnotea,b
Figure 2. Binding poses of 7 to four CA isozymes obtained through molecular docking using Smina program. The ligand poses can be seen inside the catalytic site. In addition, some poses show the inhibitor bound in the adjacent pocket (oriented to the left) to the entrance at the active site cavity in the case of isoforms CA I, II, and XII.
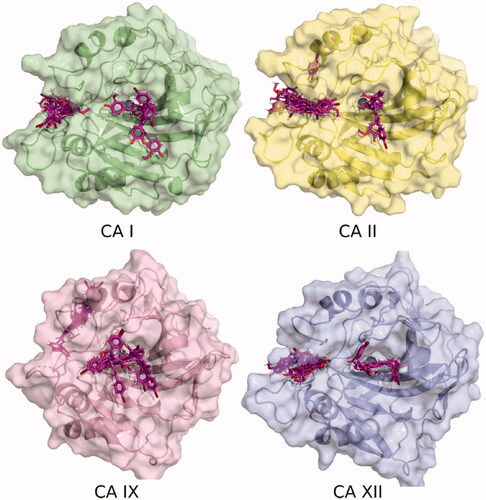
Table 3. Binding free energies (kcal mol−1) of ligands with hCA I and hCA II calculated with MM-GBSA.
Figure 3. Per-residue decomposition of binding energy (only the enthalpy term considered) of ligand-bound hCA I and II, located in the pocket adjacent to the catalytic site. These calculations were performed with the MMPBSA.py module and plotted using Python's Matplotlib library. The residues shown were those that evidenced at least one interaction of < 0.3 kcal mol−1 with a ligand.
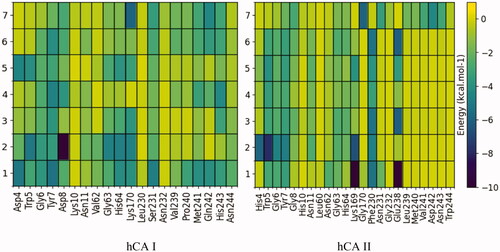
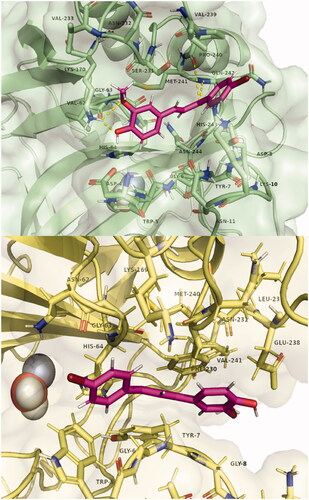
Figure 4. Poses of compound 7 bound in the adjacent pocket to the active site entrance of hCA I (above) and hCA II (below). Hydrogen bonds with residues Lys170, Pro 240, and Gln242 are highlighted in yellow. Images were generated with Pymol. The selected structures of all ligands with CAs are presented in the Supplementary Material.