
Figures & data
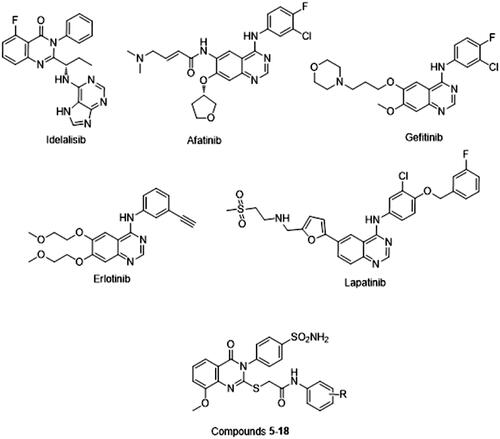
Figure 1. Quinazoline-containing drugs.
Scheme 1. Synthesis of the sulphonamide bearing methoxyquinazolinone 4-18.
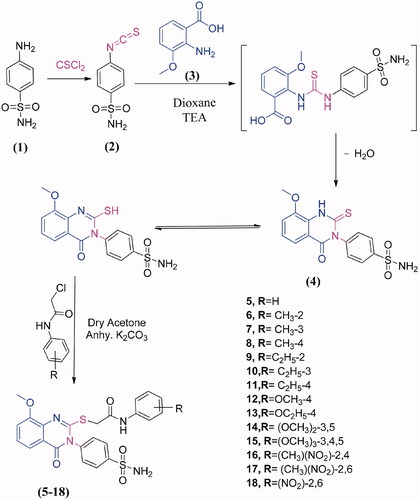
Table 1. In vitro anticancer activities of compounds 5–18 against A549, HepG2, LoVo, MCF-7 and HUVEC cell lines.
Figure 2. Cell cycle distribution of MCF-7 cells analysed by flow cytometry after treatment with compound 6 at (10, 20 and 30 μM) concentrations for 24 h. The histogram showing the cells percentage in control and treated cells. Columns, average ± SD. *p < 0.05, **p < 0.01 and ***p < 0.001 as compared to control.
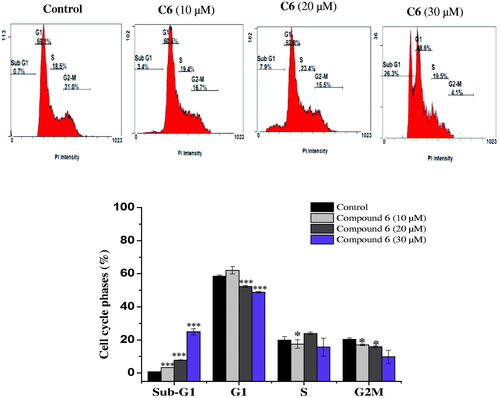
Figure 3. Cell cycle analysis of MCF-7 cells after treatment with compound 10. MCF-7 cells were treated with different concentrations of compound 10 (10, 20, 30 μM) for 24 h, stained with propidium iodide and analysed for cell cycle using flow cytometer. Columns, average ± SD. *p < 0.05, **p < 0.01 and ***p < 0.001 as compared to control.
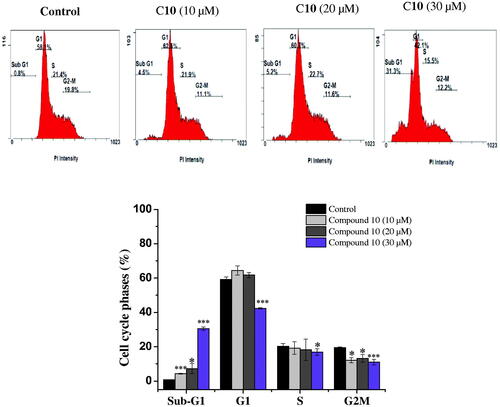
Figure 4. Apoptosis detection in MCF-7 cells using annexin V − FITC/PI double-staining assay. Cells were treated with 10, 20 and 30 μM of C6 for 24 h. Dot plots: Necrotic cells (A1), live cell (A2), late apoptotic cells (A3) and early apoptotic cells (A4). The quantitative analyses of apoptotic cells are shown in bar graphs. Data are expressed as average ± SD of three experiments.
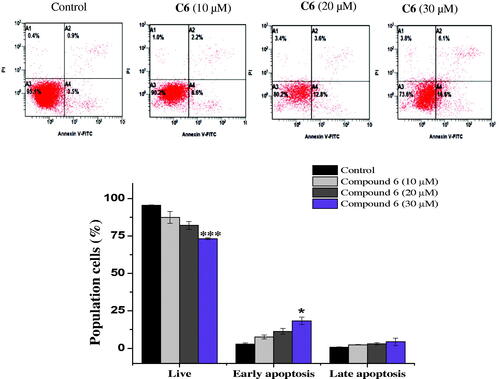
Figure 5. Effect of compound 10 on apoptosis induction of MCF-7 cells treated with various concentrations of C10 (10, 20 and 30 μM) for 24 h. Apoptosis quantification was performed by Annexin V-FITC/PI dual staining assay. Data represents replicates of three experiments, and is expressed as the average ± SD. Data was analysed using the Student’s t test.
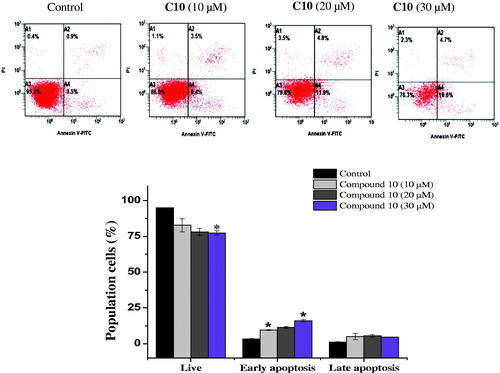
Figure 6. Evaluation of the effects of compound 6 (A) and compound 10 (B) on the expression of p53, Bax, caspase-3 and Bcl-2 using reverse transcriptase-polymerase chain reaction. MCF-7 cells were cultured and treated in the presence and absence of compound 6 (10, 20, and 30 μM) (A) and compound 10 (10, 20, and 30 μM) (B). β-actin was used as the internal control.
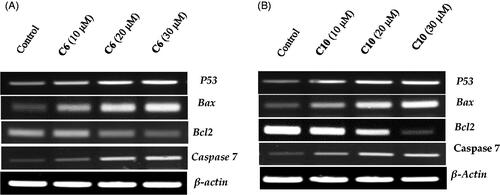
Figure 7. Evaluation of the effects of compound 6 (A) and compound 10 (B) on the protein levels of p53, Bax, caspase-7 and Bcl-2 by western blotting. MCF-7 cells were cultured and treated in the presence and absence of compound 6 (10, 20, and 30 μM) (A) and compound 10 (10, 20, and 30 μM) (B). β-actin was used as the internal control.
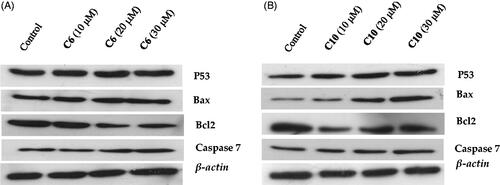
Figure 8. (A) 2D cartoon representation of the binding of DRO (control ligand), compound 6 and compound 10 at the binding site of the Bcl-2 protein, and (B) 3D representation of the binding of DRO (control ligand), compound 6 and compound 10 at the binding site of the Bcl-2 protein. DRO, compound 6 and compound 10 are represented by gold, purple and cyan sticks, respectively.
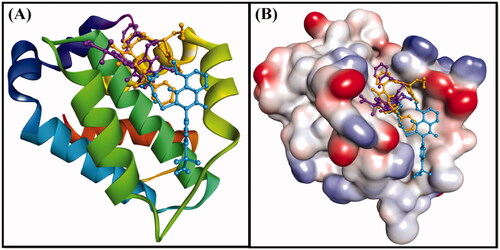
Figure 9. Molecular docking of (A) the control ligand DRO, (B) compound 6, and (C) compound 10, with the Bcl-2 protein.
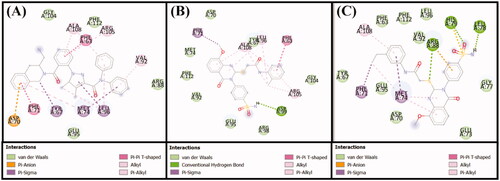
Table 2. Molecular docking of compounds 6 and 10 with Bcl-2
Table 3. List of primer sequences used for reverse transcriptase-polymerase chain reaction in this study. F: Forward, R: Reverse