
Figures & data
Figure 1. (A) Surface representation of hCA II active site in adduct with superimposed trithiocarbonate (cyan, PDB 3K7K) and the DTC morpholinocarbodithioate 23 (magenta, PDB 3P5A). The hydrophobic half of the CA active site is shown in red, and the hydrophilic one in blue; the proton shuttle residue His64 is shown in green. Cartoon view of hCA II active site in complex with B) trithiocarbonate and C) DTC 23.
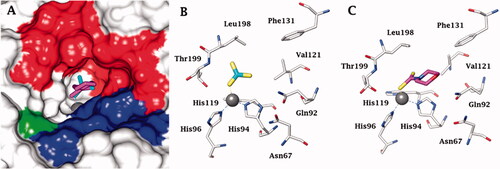
Table 1. Inhibition constants (KIs) of DTC inhibitors 1–31 against hCA I, II, and NgCA by a stopped flow CO2 hydration assay, using acetazolamide (AAZ) as the standard drugCitation12.
Table 2. Minimum inhibitory concentrations of DTCs versus N. gonorrhoeae clinical isolates.