Figures & data
Scheme 1. Reactions catalysed by ACC.
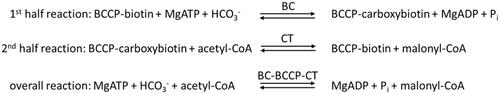
Figure 1. Structure of BC showing the ATP and biotin binding sites. ATP, ADP, aminooxazole, benzimidazole carboxamide, and pyridopyrimidine bind in the ATP binding site. Biotin, bicarbonate, and phosphate bind in the biotin binding site. Generated with PyMOL.
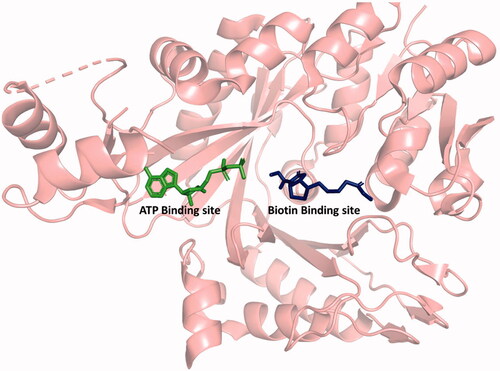
Figure 2. Structure of SABA1.
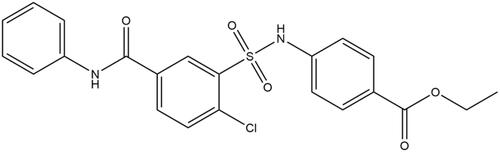
Figure 3. Inhibition of BC by SABA1 with respect to ATP. The concentration of ATP was varied at fixed increasing concentrations of SABA1. Biotin was held constant at subsaturating levels. Curves are the best fit of the data to EquationEquation (1)(1)
(1) . Points are the experimentally obtained velocities.
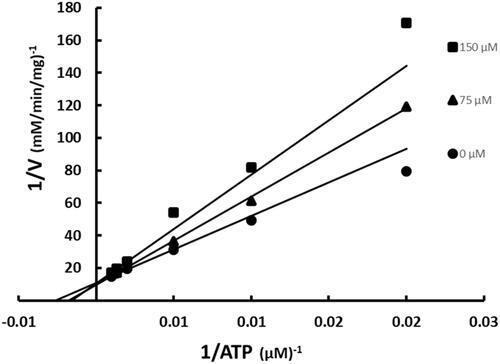
Figure 4. Inhibition of BC by SABA1 with respect to biotin. The concentration of biotin was varied at fixed increasing concentrations of SABA1. ATP was held constant at subsaturating levels. Curves are the best fit of the data to EquationEquation (1)(1)
(1) . Points are the experimentally obtained velocities.
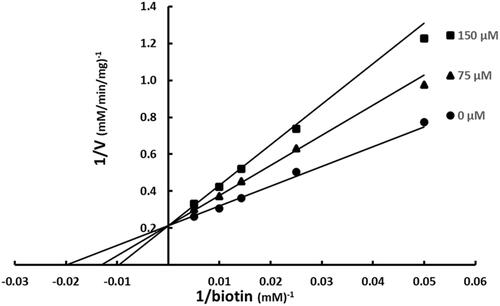
Figure 5. Multiple inhibition pattern for aminooxazole and SABA1. The concentration of aminooxazole was varied at fixed increasing concentrations of SABA1. ATP and biotin were held constant at subsaturating levels. Curves are the best fit of the data to EquationEquation (3)(3)
(3) . Points are the experimentally obtained velocities.
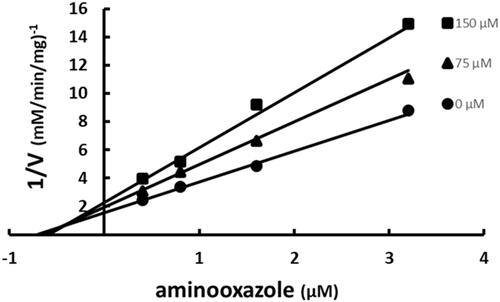
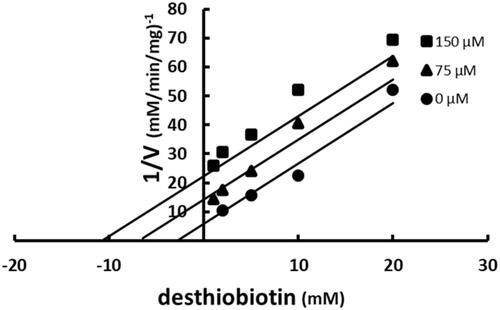
Figure 6. Multiple inhibition pattern for desthiobiotin and SABA1. The concentration of desthiobiotin was varied at fixed increasing concentrations of SABA1. ATP and biotin were held constant at subsaturating levels. Curves are the best fit of the data to EquationEquation (3)(3)
(3) . Points are the experimentally obtained velocities.
Scheme 2. Reaction scheme showing SABA1 binding to the ADP-bound enzyme.
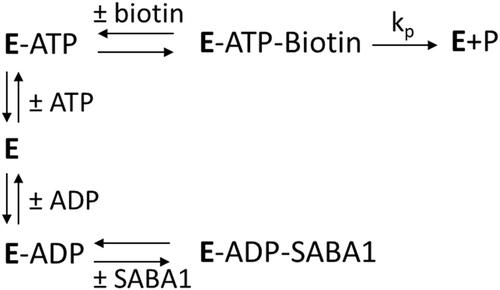
Figure 7. The effect of ADP on the apparent inhibition constant of SABA1. The curve is the best fit of the data to EquationEquation (5)(5)
(5) , indicating uncompetitive inhibition. Points are the experimentally obtained velocities.
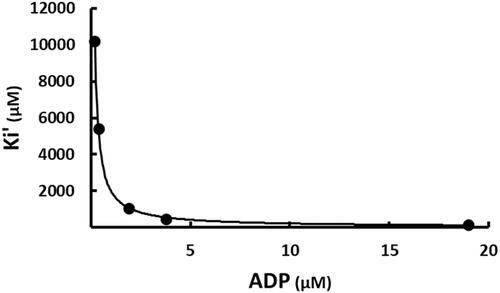
Figure 8. Inhibition of ACC by SABA1 with respect to ATP. The concentration of ATP was varied at fixed increasing concentrations of SABA1. Acetyl-CoA was held constant at subsaturating levels. Curves are the best fit of the data to EquationEquation (2)(2)
(2) . Points are the experimentally obtained velocities.
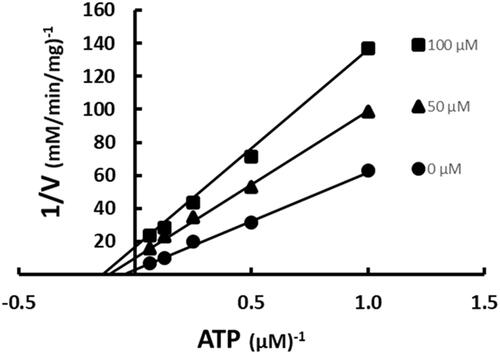
Figure 9. SABA1 docked into the biotin binding pocket of free BC. (A) R338 hydrogen bonds to the carbonyl oxygen in the benzylamide of SABA1. Yellow dashes represent hydrogen bonds, lengths are in Å. (B) Partial surface representation showing the interactions between the ethyl ester and phenyl group of SABA1 with the positive pocket and hydrophobic patch of BC respectively. In the surface representation, red is oxygen, blue is nitrogen, and green is carbon. A and B were generated with PyMOL.
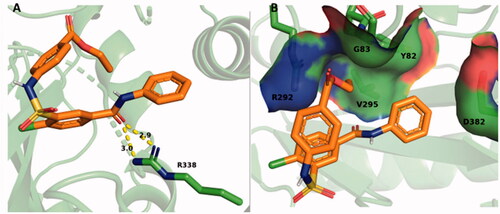
Figure 10. SABA1 docked into the biotin binding pocket of BC bound to ADP. (A) Hydrogen bonds from BC and ADP to SABA1. Yellow dashes represent hydrogen bonds, lengths are in Å. (B) Partial surface representation showing the interactions between the phenyl group of SABA1 and hydrophobic patch of BC. In the surface representation, red is oxygen, blue is nitrogen, and green is carbon. A and B were generated with PyMOL.
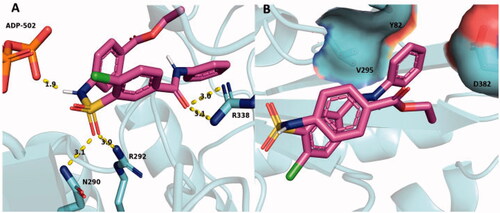
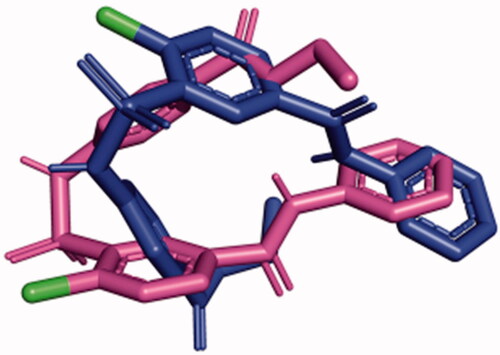
Figure 11. SABA1 in the presence of AMAPCP (blue) was overlayed onto SABA1 in the presence of ADP (magenta). Note the position of the chlorine atoms (green) is flipped. Generated with PyMOL.