
Figures & data
Figure 1. MpaCA amino acid sequence (A) and schematic representation (B) of the β-CA class consensus domains. Legend: lower letter case, MpaCA amino acid sequence; solid black line, polypeptide chain; solid light blue line, β-CA superfamily conserved domain; red triangles, conserved amino acids present at the enzyme’s zinc-binding site; green triangles, conserved amino acids present at the enzyme’s dimer interface; blue triangles, conserved amino acids present at the enzyme’s active site.
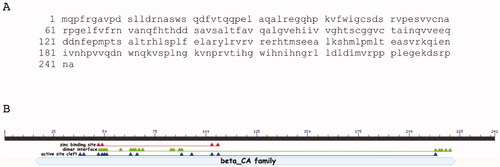
Figure 2. Multi-alignment of the β-CA polypeptide chains belonging to three Malassezia species, namely M. pachydermatis, M. restricta, and M. globosa. The multiple sequence alignment was obtained using the program MUSCLE. Legend: MpaCA, β-CA from M. pachydermatis; MreCA, β-CA from M. restricta; MgCA, β-CA from M. globosa; red amino acids, conserved residues present at the enzyme’s zinc-binding site; blue amino acids, conserved residues present at the enzyme’s catalytic dyad; asterisk indicates positions that have a single, fully conserved residue; colon indicates conservation between amino acids with strong chemico-physical properties; dot indicates conservation between amino acids with weak chemico-physical properties.
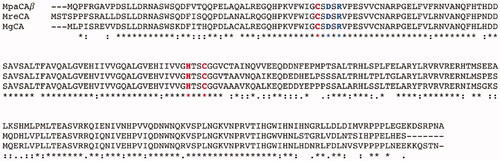
Figure 3. Radial dendrogram showing the evolutionary relationships of the β-CAs from various prokaryotic and eukaryotic species, such as plants, bacteria, insects, algae, and fungi. Species names and sequence acronyms are reported on the left of the figure. The accession number of the amino acid sequences used in the phylogenetic analysis are indicated below the sequence acronym shown in the radial dendrogram.
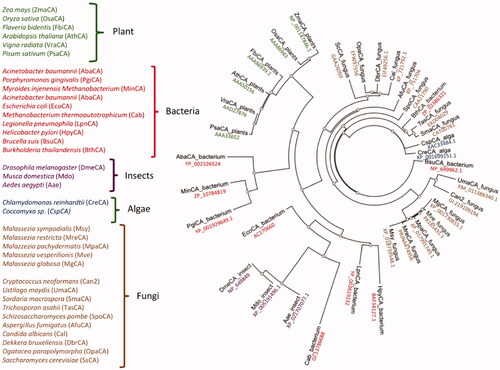
Figure 4. SDS-Page electropherogram (A) and protonogram (B). Legend: Lane Std, molecular markers, molecular mass values starting from the top: 75, 50, 37, 25, and 20 kDa; Lane 1: MpaCA band detected after staining Coomassie blue; Lane 2: MpaCA activity responsible for the reduction in pH from 8.2 to the transition point of the dye. The protein component corresponding to MpaCA is represented by the yellow band.
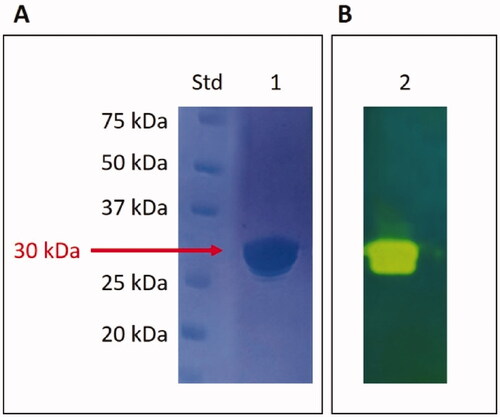
Table 1. Kinetic parameters of MpaCA compared with those of MgCA, MreCA and human isoenzyme hCA I and hCA II (α-class).