Figures & data
Figure 1. Representative structures of ERRα inverse agonists that had been reported.
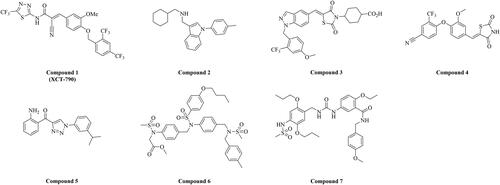
Figure 2. Design of compound 11 as the potential ERRα inverse agonist.
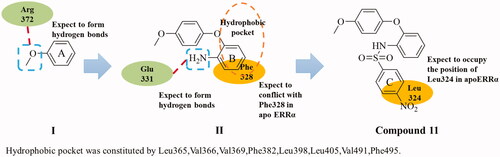
Figure 3. RMSD between co-crystallized ligand (compound 2) and docking pose. The docking pose was generated by Surflex-dock package in Sybyl X 2.0. The RMSD was calculated by Discovery studio 2019.
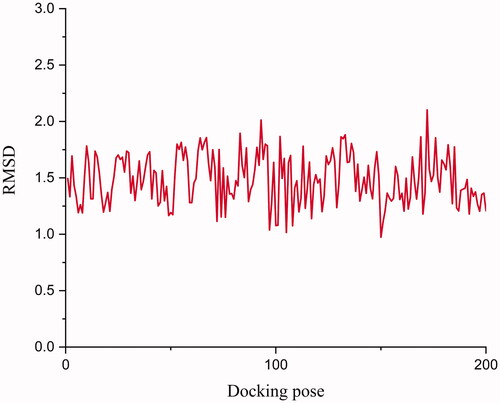
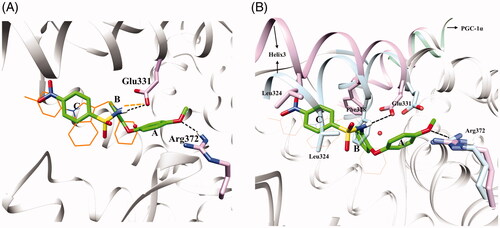
Figure 4. (A) Superimposition of docking result of ERRα with compound 11 (green) and crystal structure of ERRα with inverse agonist (compound 2, orange, PDB code 2PJL). The dotted black lines in the figure represent the hydrogen bonding interactions between ligand and protein. (B) The superimposed apoERRα crystal complex (1XB7) and compound 11 (green) docked with ERRα inverse agonist crystal complex crystals (2PJL). Plum: 2PJL, Sky blue: 1XB7. The dotted black lines in the figure represent the hydrogen bonding interactions between ligand and protein. These photographs were obtained by the chimaera 1.15rc program.
Scheme 1. (a) K2CO3, DMF, 120 °C, 7–8 h; (b)/(e)/(g) Ni2Cl·6H2O, NaBH4, MeOH, 0 °C, 2 h; (c) Pyridine, DCM, 0 °C, 8 h; (d) NaH, DMF, 90 °C, 7–8 h; (f) K2CO3, MeOH, 60 °C, 5–6 h.
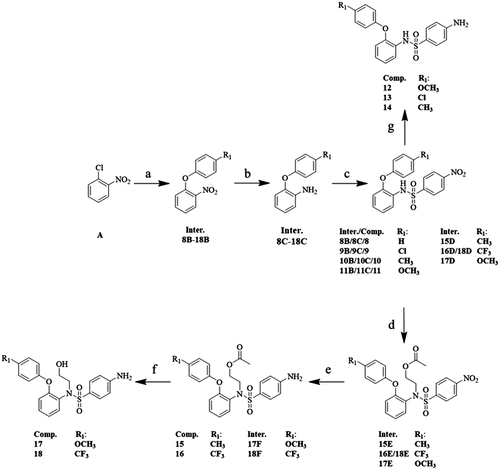
Table 1. The inhibition of compounds 8–18 on ERRα transcriptional activity.
Figure 5. Compound 11 inhibits growth and colony formation of breast cancer cells. (A) Influence of compound 11 on the viability of breast cancer cells MDA-MB-231, MCF-7 and HCC-1937. Cells were treated with vehicle or compound 11 (1, 3, 10 μM) for 24 h and 48 h, the viability was detected with the CCK-8 kit. (B) Breast carcinoma cells were treated with various concentrations of compound 11 for 24 h. Cell proliferation was determined by the CCK-8 assay. IC50 value of compound 11 in breast cancer cell lines was then determined. (C) Efficacy of compound 11 on colony formation of breast cancer cells. (D) Breast cancer cells were treated with compound 11 (0.3, 1 μM) for 7 days, and then fixed, stained and counted. Values are the means ± SEM (n = 3). *p < 0.05 or **p < 0.01 indicates significant differences from the vehicle group as assessed by a two-tailed unpaired Student’s t-test.
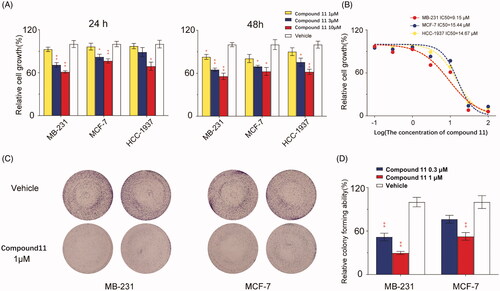
Figure 6. Compound 11 inhibits breast cancer cells migration and invasion. (A, B) MCF-7 and MDA-MB-231 cells were treated with compound 11 (1, 3 μM) for 24 h. Transwell migration assays were used to determine the migratory ability of MCF-7 and MDA-MB-231 cells. The experiments were performed in quadruplicate, and data represent mean ± SEM, *p < 0.05 and **p < 0.01. (C, D) MCF-7 and MDA-MB-231 cells were treated with compound 11 (1, 3 μM) for 24 h. Transwell invasion assays were performed in Matrigel to determine the invasion ability of MCF-7 and MDA-MB-231 cells. Values are the means ± SEM (n = 4). *p < 0.05 or **p < 0.01 indicates significant differences from the vehicle group as assessed by a two-tailed unpaired Student’s t-test.
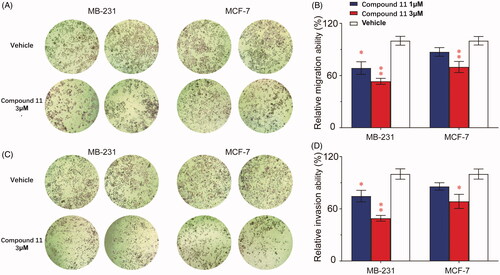
Figure 7. Compound 11 is an inverse agonist of ERRα. (A) TR-FRET assay was used to detect whether compound 11 could bind to ERRα LBD to suppress the interaction with PGC-1α peptide. (B) Effect of compound 11 on the viability of MB-231 cells after treatment with shERRα or shCtrl. Values are the means ± SEM (n = 3). *p < 0.05 or **p < 0.01 indicates significant differences from the vehicle group as assessed by a two-tailed unpaired Student’s t-test.
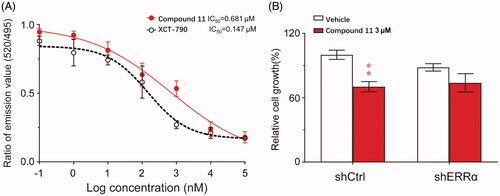
Figure 8. Compound 11 down-regulates the expression of ERRα-regulated target genes. (A–C) MDA-MB-231 cells were incubated with vehicle or compound 11 (1, 3 μM) for 24 h, and the mRNA levels of ERRα target genes (PDK4, pS2 and osteopontin) were determined by RT-PCR analysis. (D) Effect of compound 11 on mRNA levels of PGC-1α. Values are the means ± SEM (n = 3). *p < 0.05 or **p < 0.01 indicates significant differences from the vehicle group as assessed by a two-tailed unpaired Student’s t-test.
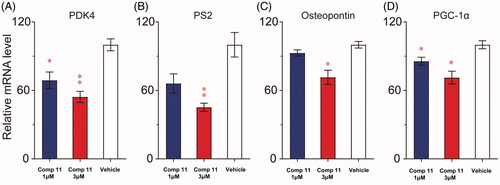
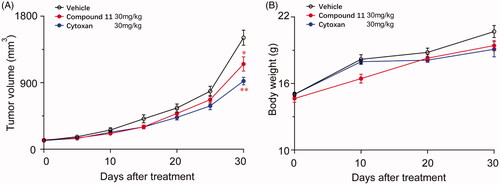
Figure 9. Compound 11 suppresses the growth of breast tumours in mice xenograft models. (A) The volume of the MDA-MB-231 xenograft tumour was measured after 30 days of treatment with vehicle or compound 11. Compound 11 was intraperitoneally injected 30 mg/kg every other day. (B) The body weight of mice in different treatment groups. Values are the means ± SEM (n = 6). *p < 0.05 or **p < 0.01 indicates significant differences from the vehicle group as assessed by a two-tailed unpaired Student’s t-test.