Figures & data
Figure 1. Binding interactions of BTK. (A) hydrogen-bonding and (B) hydrophobic interactions between BTK inhibitors and residues. Residue interactions with ≤ 50% compounds were identified as binding interactions. (C) The binding pose of ATP (purple) in the BTK binding site (yellow). Green dashes denote hydrogen bonds. Residues are labelled and shown as lines.
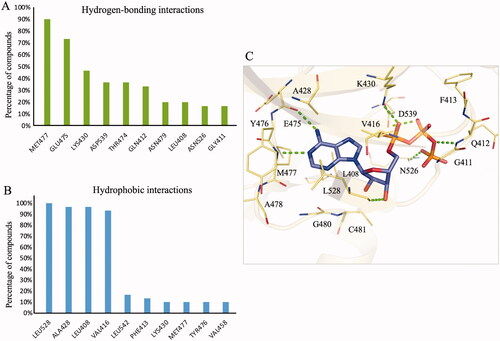
Figure 2. Interaction analysis of compound NSC726558. (A) The docking pose of compound NSC726558 (blue) in the BTK binding site (yellow). Residues are labelled and shown as lines. Green dashes denote hydrogen bonds. (B) The docking pose in 2D of NSC726558 in the BTK binding site. Black dash lines denote hydrogen bonds. Hydrophobic pockets are resented by a green spline and π interaction is shown as a green dashed line.
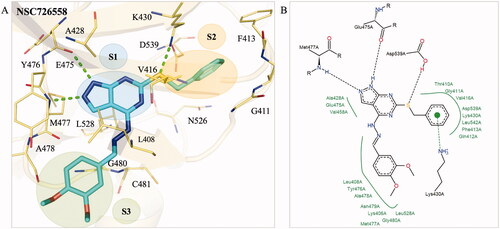
Figure 3. BTK inhibition with compound NSC726558 in cancer cells. (A) Colon cancer cells treated with different concentrations of the compound for 72 h were examined by MTT assay. (B) The IC50 of compound NSC726558 in the indicated cancer cells. (C) The western blot assay of cancer cells treated with NSC726558 for 48 h.
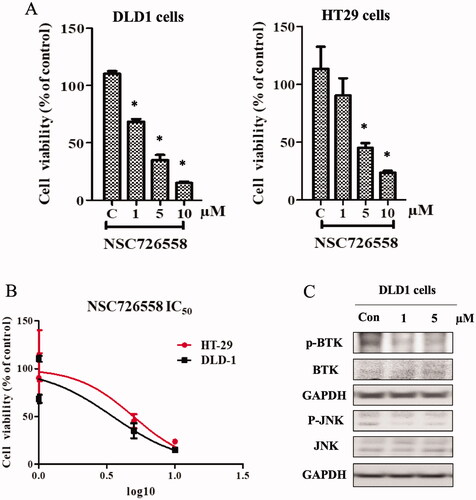
Figure 4. Inhibition assays of NSC726558 analogues. The 14 analogues were tested for BTK inhibitory activity at 10 µM. Active inhibitors produced an inhibition activity ≤ 50%.
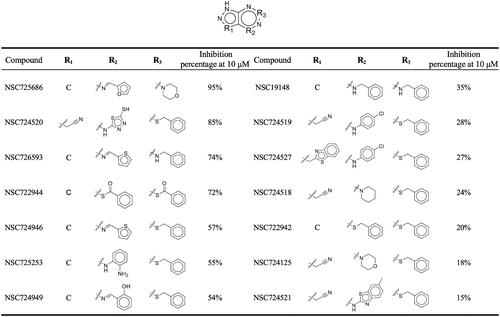
Table 1. The IC50 values of the top four analogues.
Figure 5. Interaction analysis of analogue NSC725686. (A) The docking pose of analogue NSC725686 (blue) in the BTK binding site (yellow). Green dashes designate hydrogen bonds and residues are labelled and shown as lines. (B) A 2D interaction pose of the analogue NSC725686 was generated. Hydrogen bonds are represented as black dashes and hydrophobic pockets as green splines.
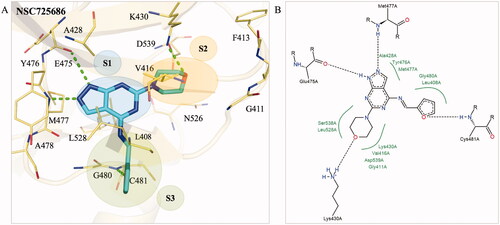
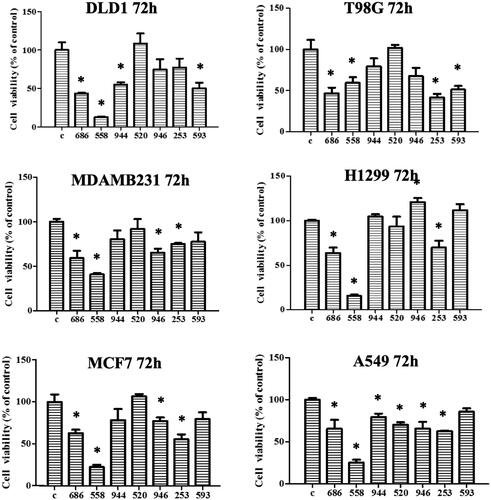
Figure 6. Compound NSC726558 shows potency in different cancer cell lines. A MTT assays of NSC726558 analogues was performed. The cancer cell lines were treated with 20 µM of the indicated compounds for 72 h and then analysed for cell viability. Colon cancer cells (DLD1), glioblastoma cells (T98G), breast cancer cells (MDAMB231 and MCF7), and lung cancer cells (H1299 and A549) were applied in the experiment.