Figures & data
Figure 1. TP and 2dR1P roles in tumour development.
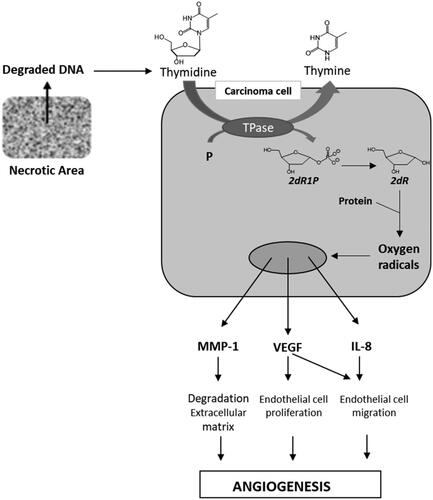
Figure 2. Schematic representation of the pyridimidinedione binding site of hTP and chemical structures of 7-DX and TPI.
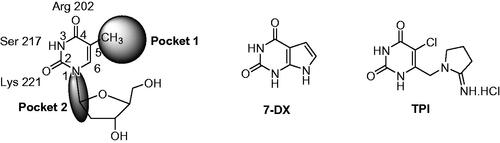
Figure 3. General structures of the designed derivatives in series A–D.
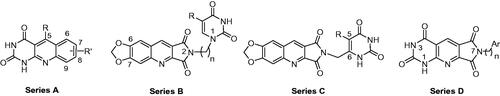
Table 1. Synthesis of the pyrimido[4,5-b]quinoline-2,4(1H,3H)-diones 2. 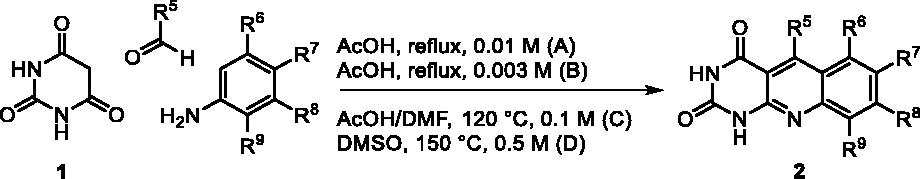
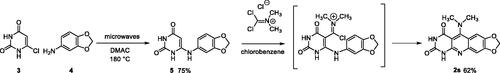
Scheme 1. Synthesis of compound 2s.
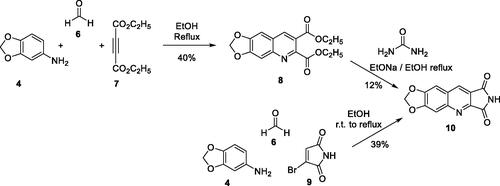
Scheme 2. Synthesis of compound 10.
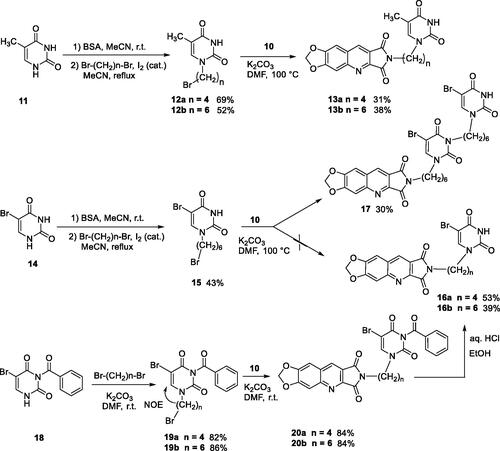
Scheme 3. Synthesis of compounds 13a, 13b, 16a, 16b, and 17.
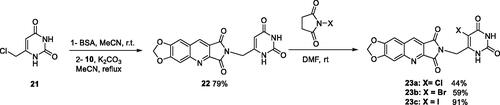
Scheme 4. Synthesis of compounds 22 and 23a–c.
Scheme 5. Synthesis of compounds 28a–h and 30.
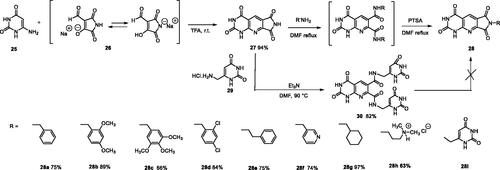
Table 2. Escherichia coli TP inhibition of series A derivatives.
Table 3. Escherichia coli TP inhibition of series B and C derivatives.
Table 4. Escherichia coli TP inhibition of series D derivatives.
Figure 4. Docking superposition in the hTP active site of compounds 2d (in blue), 2e (in pink), 2i (in orange), and TPI (in green).
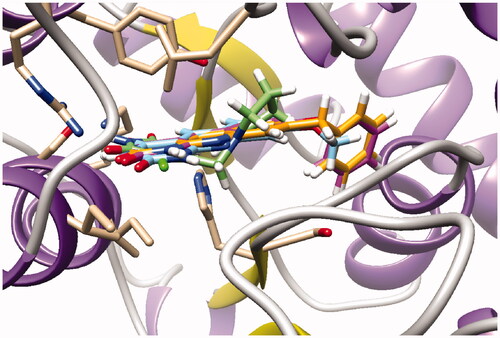
Figure 5. Docking superposition in the hTP active site of TPI (in green), compounds 16b (dark green cloud), and 23b (white cloud).
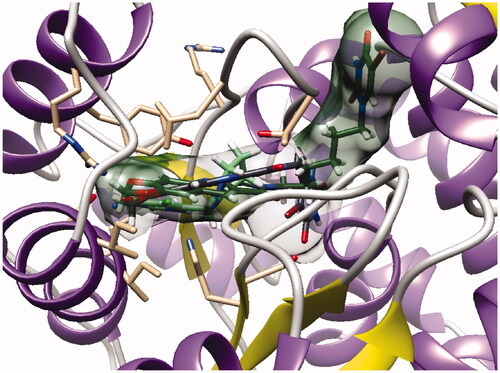
Figure 6. Docking superposition in the hTP active site of compounds 2i (in orange), 28a (in purple), and 30 (in blue).
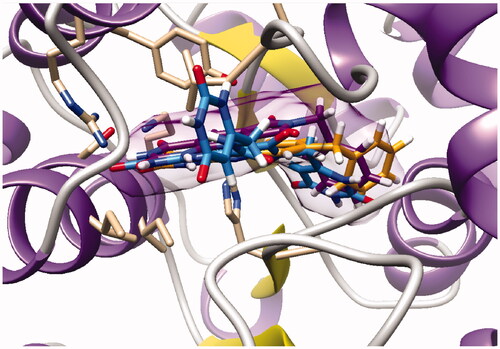
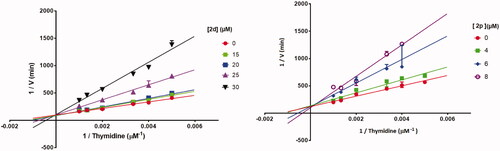
Figure 7. Lineweaver–Burk plots of E. coli TP inhibition by 2d and 2p, in the presence of variable concentrations of thymidine demonstrating competitive-type enzyme inhibition. Results are presented as means ± SD; SD denoted by error bars (experiments carried out in triplicate).