Figures & data
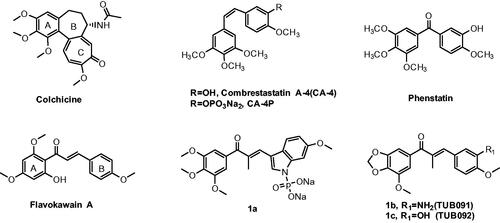
Figure 1. Representive tubulin inhibitors with anti-angiogenesis potency.
Scheme 1. Reagents and conditions: (a) TBABr3, DCM: MeOH = (5:2), rt, overnight; (b) KF,18-crown-6, MeCN; (c) MeOH or ethanol or THF or Dioxane, appropriate base, 0–75 °C.
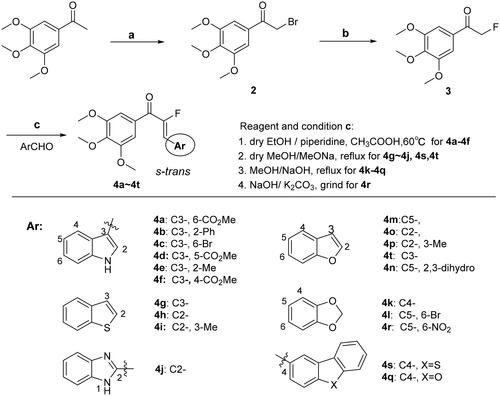
Table 1. Antiproliferative activities of all target compounds against different human cell lines
Figure 2. Effect of 4c on tubulin polymerisation in vitro. Data are presented as the mean ± SD from three independent experiments.
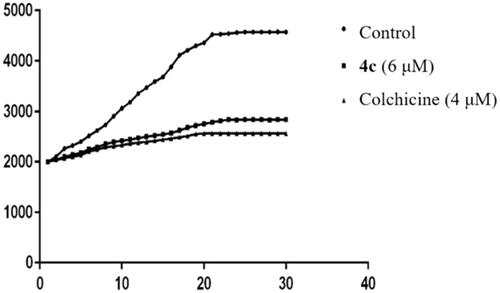
Table 2. Growth inhibitory effects of 4c on macrophage.
Figure 3. Proposed binding models for 4c (green) with tubulin (PDB code:5JVD). (A) The superimposed conformation with TUB092(carmine). The hydrogen bonds were shown in yellow dashed lines. (B) The 2 D interactions between 4c and tubulin.
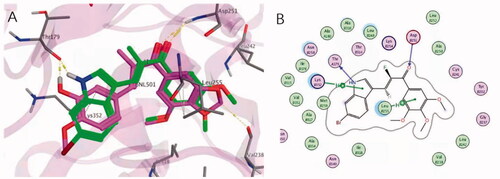
Figure 4. Effects of 4c on the cellular microtubule network visualised by immunofluorescence.
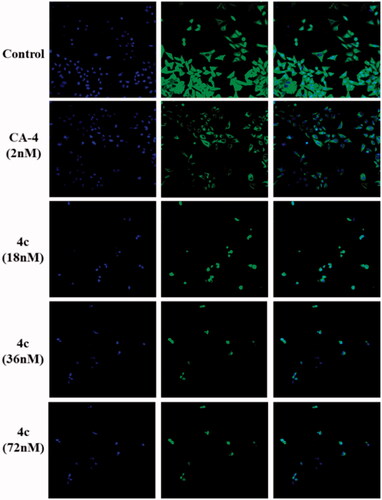
Figure 5. Compound 4c induced G2/M arrest in MGC-803 cancer cells. (A) The percentages of cells at different phase of the cell cycle after treatment with various concentrations of 4c. (B) Histograms display the percentage of cell cycle distribution. (C) The percentage of different phase of the cell cycle after treatment with the same concentration for different times. (D) Histograms display the percentage of cell cycle distribution for different times. (E) Western blotting analysis on the effect of 4c on the G2/M regulatory proteins. (F) Histograms display the density rations of p-Cdc2, CyclinB1 and P21.
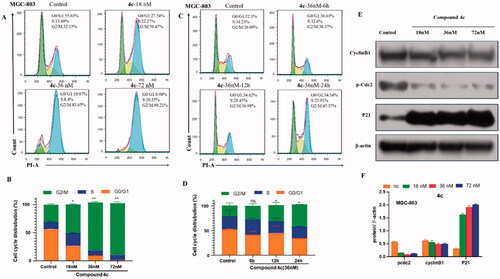
Figure 6. Compound 4c induced apoptosis in MGC-803 cancer cells. (A) MGC-803cells stained with Annexin V/PI, followed by flow cytometric analysis. (B) Western blot analysis of apoptosis-related proteins. (C) Histograms display the percentage of apoptosis cells. (D) Histograms display the density ratios of Caspase -3/-7/-9, cleaved Caspase -3/-7/-9, Parp and cleaved Parp.
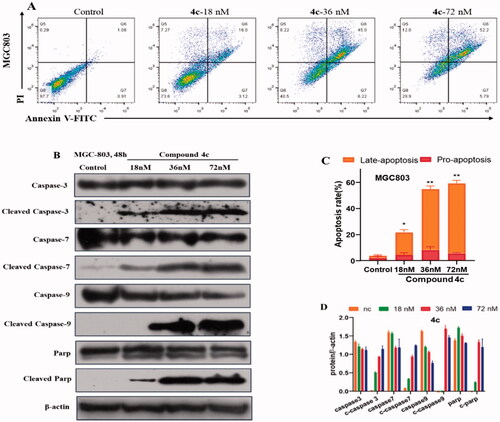
Figure 7. (A) Effects of 4c on the MMP of MGC-803 cells; (B) The generation of ROS was measured using DCFH-DA.
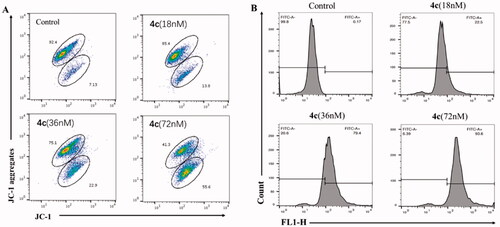
Figure 8. Effects of compound 4c on the migration and invasion of MGC-803 cells. (A) Images of MGC-803 cells migration inhibited by 4c; (B) Suppressing effects of 4c on the invasion of MGC-803 cells; (C) Histograms display the percentage of healing cells; (D) Histograms display the percentage of invasion cells.
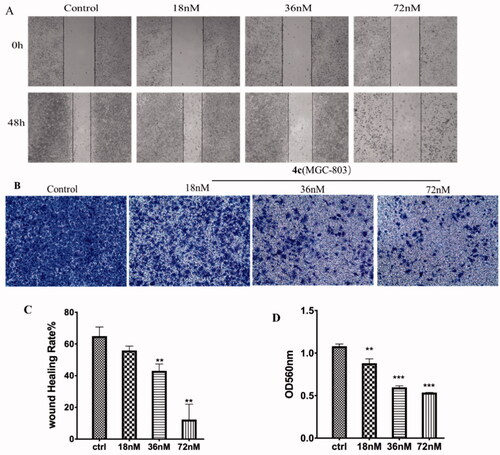
Figure 9. Effects of compound 4c on the migration and invasion of HUVEC. (A) Images of HUVEC migration inhibited by 4c; (B) Suppressing effects of 4c on the invasion of HUVEC; (C) Histograms display the percentage of healing cells; (D) Histograms display the percentage of invasion cells.
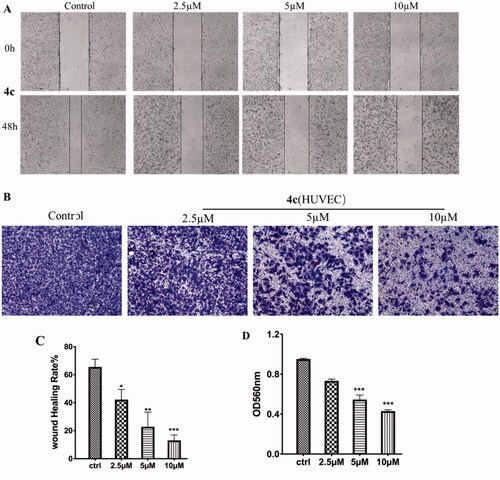
Figure 10. Effects of compounds 4c on the tube formation of HUVECs in vitro; (A) Images for the tube-forming inhibitory activities for 4c (0, 2.5, 5, 10 µM) in HUVECs; (C) Statistical analysis for the tube-forming capability. *p < 0.05, **p < 0.01,vs. control; ***p < 0.001 vs. control.
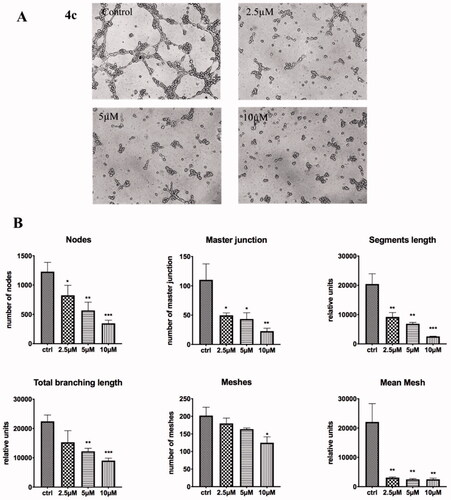
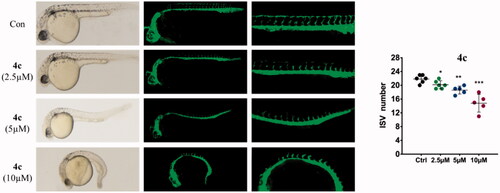
Figure 11. Anti-angiogenic effect of compounds 4c in zebrafish embryos assay. Zebrafish embryos were incubated with 4c at 0.5, 1, and 2 µM for 24 h.