
Figures & data
Figure 1. Molecular structures of the tested compounds.
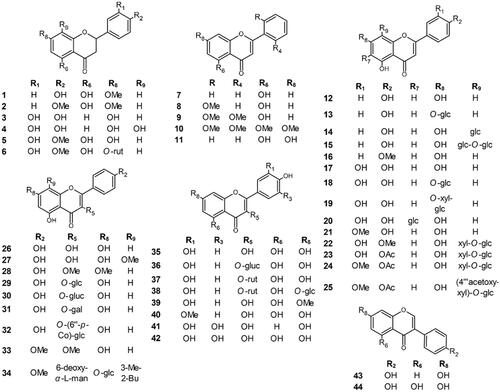
Table 1. Compounds 1–44 measured for anti-tyrosinase activity and their respective IC50 values.
Figure 2. Lineweaver–Burk plots for inhibition of tyrosinase in the presence of compounds: 4 (A), 17 (B), 26 (C), 32 (D), 35 (E), and 41 (F). The concentrations of the compounds were 0.00, 25, and 50 µM. The substrate L-DOPA concentrations were 0.25, 0.50, 1, and 2 mM.
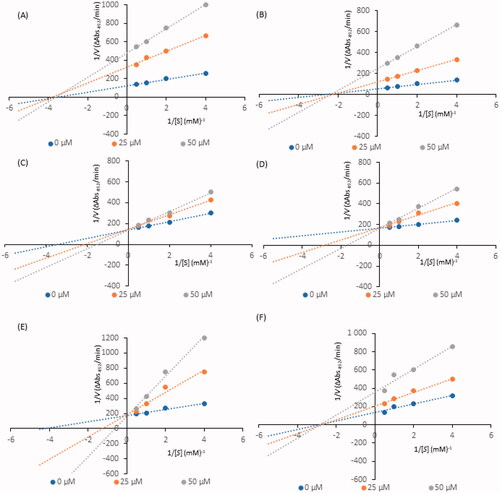
Figure 3. Dixon plots for inhibition of tyrosinase in the presence of compounds: 4 (A), 17 (B), 26 (C), 32 (D), 35 (E), and 41 (F). The concentrations of the compounds were 0.00, 25, and 50 µM. The substrate L-DOPA concentrations were 0.25, 0.50, 1, and 2 mM.
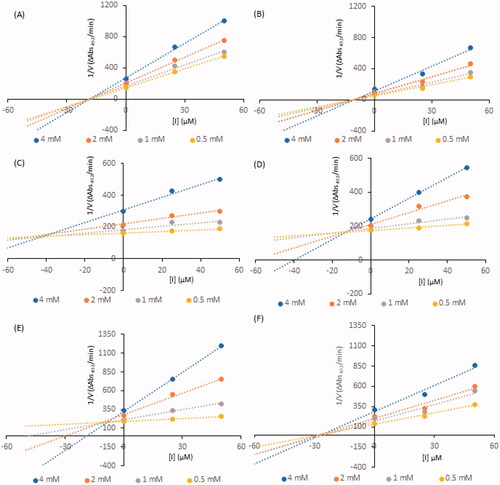
Table 2. Kinetic analysis of active compounds on tyrosinase.
Table 3. Docking scores of the active flavonoids.
Figure 4. Predicted binding mode of compounds 4 (A), 17 (B), 26 (C), 32 (D), 35 (E), and 41 (F) in the tyrosinase active site. Compounds are represented as colour stick balls, interacting tyrosinase residues as grey sticks, Cu2+ as orange spheres, their histidine ligands as wireframes, and binding interactions as colour dashed lines. The distances between Cu2+ and interacting atoms are shown in Å.
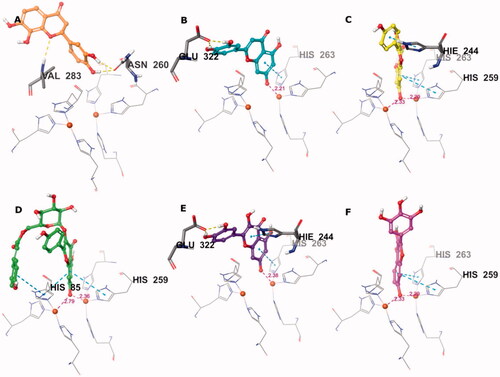
Figure 5. Binding interactions of compounds 4 (A), 17 (B), 26 (C), 32 (D), 35 (E), and 41 (F) with the tyrosinase active site residues. Binding interactions are shown as coloured lines, and compound moieties exposed to solvent are highlighted with grey shades.
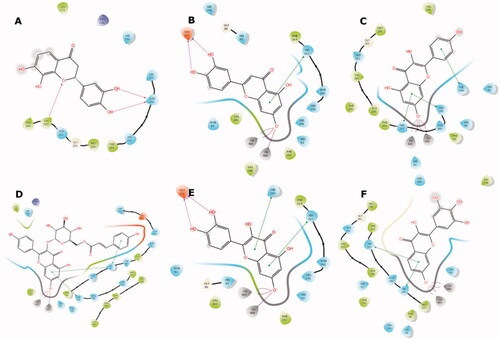
Table 4. Attributes definitions used to for the statistical analysis.
Table 5. The multivariate linear regression model for the ln IC50.