Figures & data

Scheme 1. Synthesis of oleanolic acid oxime ester derivatives (3a–3t). Reagents and conditions: (a) Jones reagent, acetone, 0 °C; (b) NH2OH·HCl (1.0 eq.), EtOH, NaOAc (2.0 eq.), rt, 1 h; (c) cinnamoyl chlorides and benzoyl chlorides (2.0 eq.), pyridine, DCM, 0 °C ∼ rt, overnight.
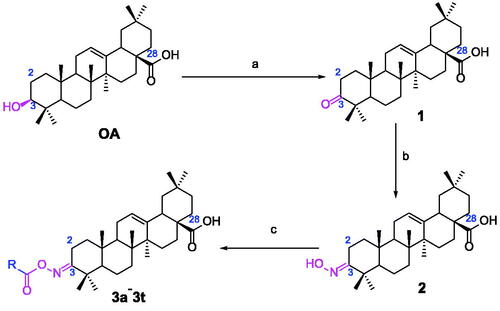
Table 1. Inhibition of all the synthesised OA derivatives against α-glucosidase and α-amylase. 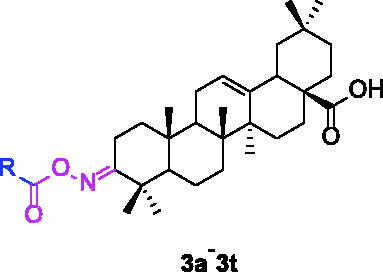
Figure 1. Inhibition kinetics of 3a on α-glucosidase. (a) The plots of enzymatic reaction rate vs α-glucosidase concentration with or without the presence of 3a; (b) Lineweaver–Burk plots of enzymatic reaction rate versus substrate concentration with or without the presence of 3a (3a concentration: black line, 0 μM; red line, 0.25 μM; blue line, 0.45 μM; pink line, 0.5 μM).
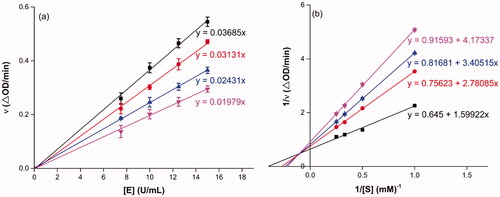
Figure 2. The molecular docking of analogue 3a with α-glucosidase (homology mode): (a) 3a in the electrostatics active pocket; (b) 3a in the active pocket; (c) 3D view of 3a with α-glucosidase; (d) 2D view of 3a with α-glucosidase.
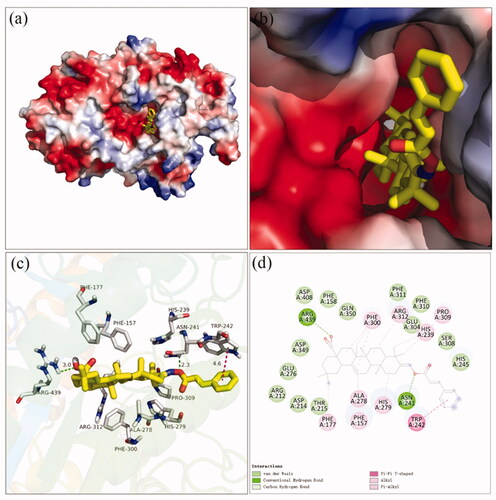
Table 2. The physicochemical properties of compounds 3a and 3f.
Figure 3. Inhibition kinetics of 3f against α-glucosidase. (a) The plots of enzymatic reaction rate vs α-glucosidase concentration with or without the presence of 3f; (b) Lineweaver–Burk plots of enzymatic reaction rate vs substrate concentration with or without the presence of 3f (3f concentration: black line, 0 μM; red line, 5 μM; blue line, 7.5 μM; pink line, 15.0 μM).
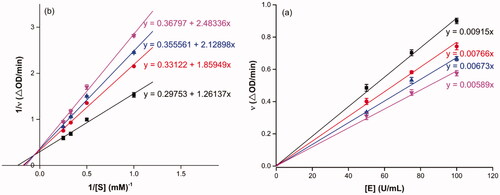
Figure 4. The molecular docking of analogue 3f and α-amylase (3BAJ): (a) 3f in the electrostatics active pocket; (b) 3f in the active pocket; (c) 3D view of 3f and α-amylase; (d) 2D view of 3f and α-amylase.
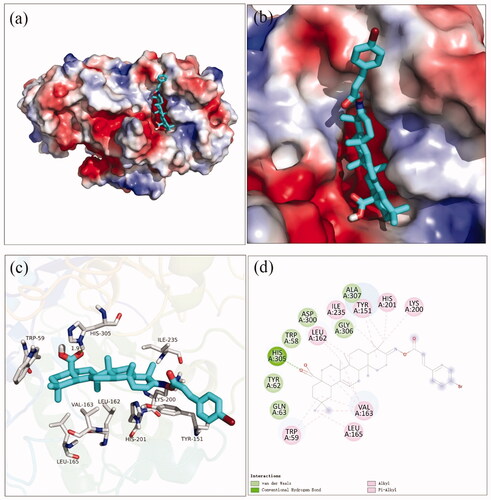
Figure 5. Cells cytotoxicity of compounds 3a and 3f against 3T3-L1 and HepG2 cells.
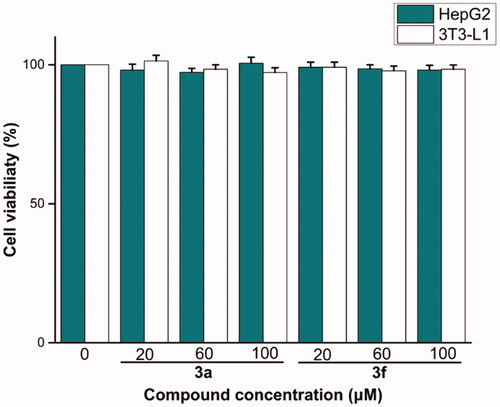
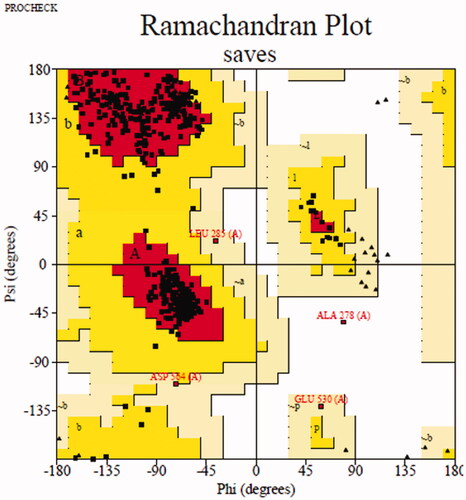
Figure 6. Ramachandran plot results of most reasonable homology mode.