
Figures & data
Figure 1. Design concept of the target benzoate esters 1–13 by applying linear homologation strategy (A); homologation and retroisosterism (B and C) and monovalent isosterism (D).
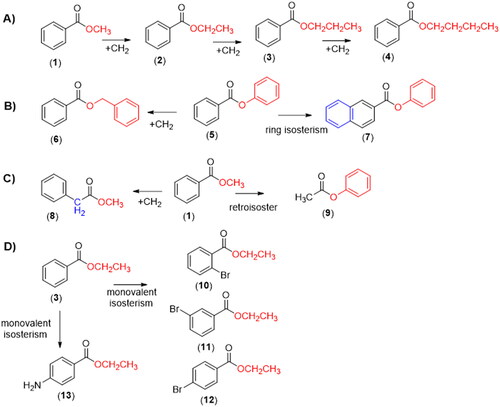
Figure 2. Proposed first step of the catalytic mechanism of hydrolysis catalysed by CEs (adapted from Yu and collaboratorsCitation42).
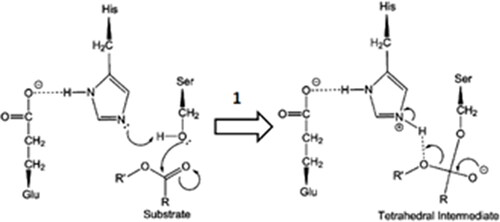
Figure 3. Comparative profile of compounds 1–12 in non-enzymatic hydrolysis using LiOH/THF:H2O, 37 °C and enzymatic hydrolysis using rat plasma and liver microsomes. Data correspond to mean ± SD (n = 3). **p-values ≤ 0.05 and *0.05 < p-values < 0.1.
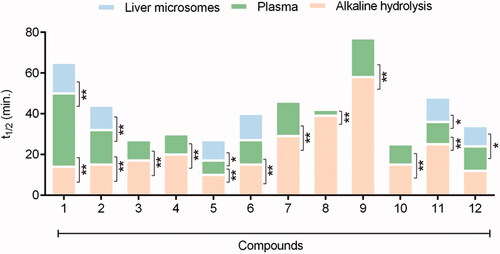
Table 1. Atomic coefficient values, energy levels of LUMO orbitals and Mülliken charge of carbonyl carbon atom, and molar refractivity of compounds 1–12 calculated by the SPARTAN 14’ program (Wavefunction Inc.)
Table 2. Comparative stability of esters 1–16, expressed by their half-life values, determined in base, rat plasma and rat liver microsomes hydrolysis conditions. Abbreviation: N.D.: Not Determined.
Figure 4. Chemical structures of benzocaine (13), flumazenil (14) and their inferior homologues 14 and 16.
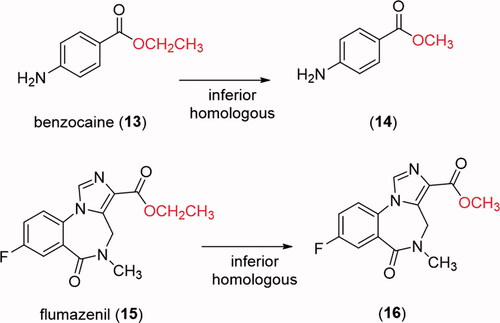
Figure 5. Comparative profile of compounds 13–16 in enzymatic hydrolysis using rat plasma. Data correspond to mean ± SD (n = 3). **p-values ≤ 0.05.
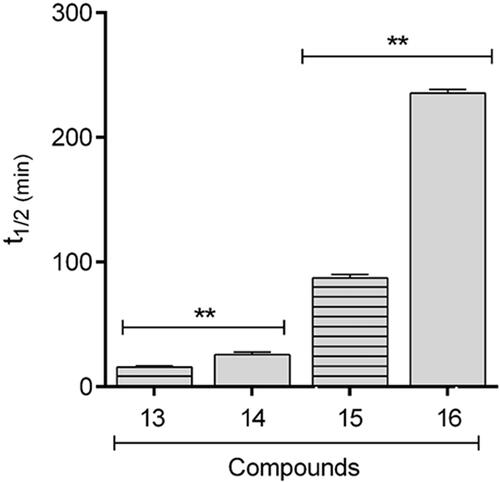
Figure 6. Percentage inhibition of in vitro plasma (A) and microsomal hepatic metabolism (B) of methyl benzoate and ethyl benzoate by selective inhibitors of carboxylesterase enzymes (Bis(p-nitrophenyl) phosphate at 1, 10, 100 μM), compared with the control group (absence of inhibitor). The data represent the mean of triplicate incubations. Values are mean ± SD. ***p-values < 0.001 compared with the control group analysed by ANOVA following a Dunnett post-test.
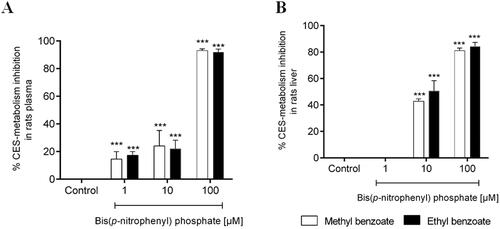
Figure 7. Structures of the tetrahedral intermediates generated from the alkaline hydrolysis for methyl (1, C atoms in yellow), ethyl (2, C atoms in magenta) n-propyl (3, C atoms in cyan) and n-butyl (4, C atoms in green) benzoates. O atoms in red and H atoms in white.
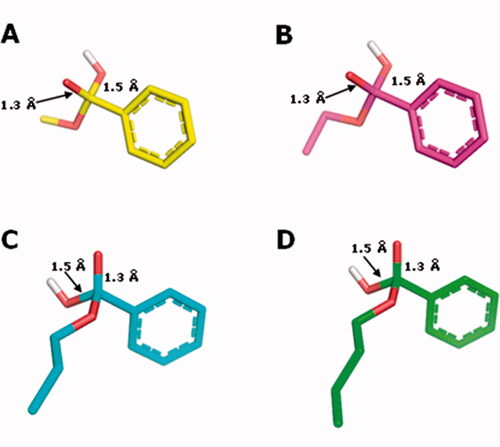
Table 3. Activation energies (kJ/mol) for the formation of the tetrahedral intermediated for base hydrolysis calculated with PM6-DH2 with the water dielectric constant.
Figure 8. TS interaction profile in the binding site of hCE1 crystallographic structure 1YAJ, for methyl (1, C atoms in yellow), ethyl (2, C atoms in magenta) n-propyl (3, C atoms in cyan) and n-butyl (4, C atoms in green) benzoates. Hydrogen bonds are indicated in grey. O atoms in red and H atoms in white.
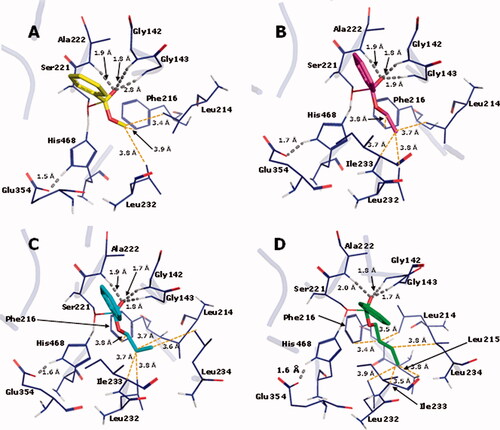
Table 4. Activation energies (kJ/mol) for the formation of the tetrahedral intermediated for enzymatic hydrolysis calculated with PM6-DH2 with the water dielectric constant.