
Figures & data

Figure 1. Chemical structures of AAZ (I), Sunitinib (II) and reported CAIs incorporating sulphonamide moieties III-VIII.
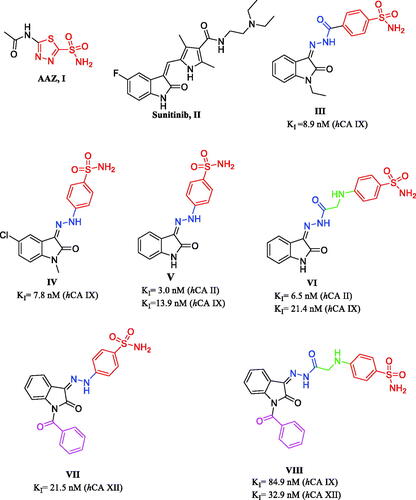
Figure 2. The rational of the newly synthesised isatin-based sulphonamide derivatives 2h, 3a-g and 4a-g.
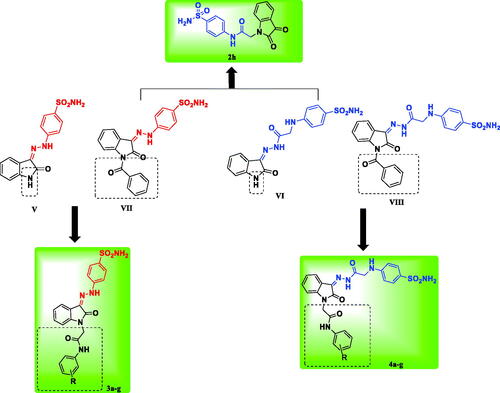
Table 1. Inhibition data of human CA isoforms hCA I, II, IX and XII with 2,3-dioxoindole sulfamoylphenyl acetamide 2h, 2-oxindole based benzenesulfonamides 3a-g, 4a-g and the standard inhibitor Acetazolamide (AAZ) using a stopped flow CO2 hydrase assay. 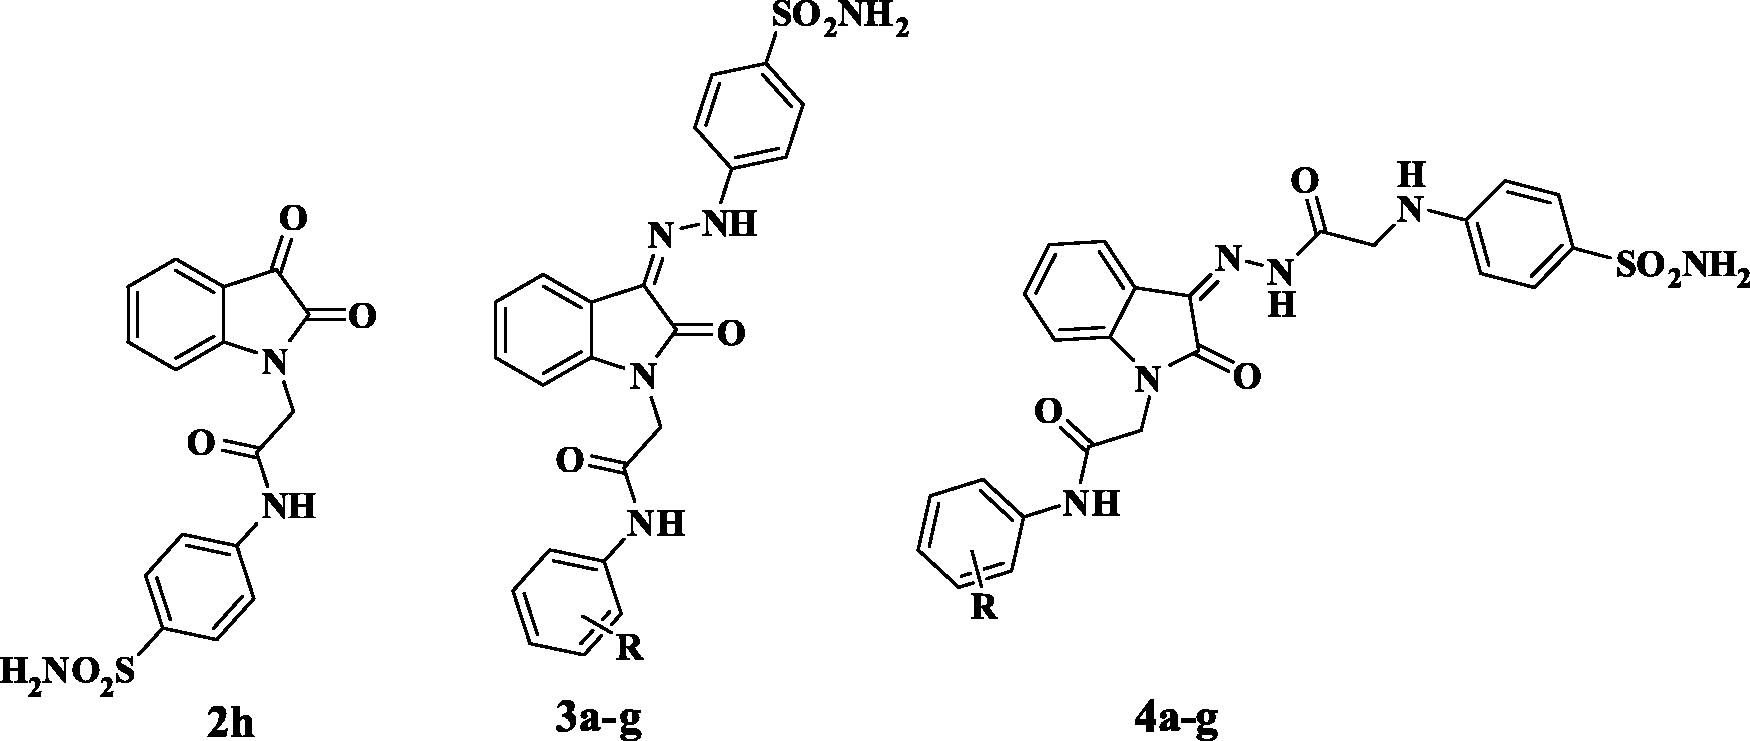
Scheme 1. Synthetic pathway for the target compounds 1–4. Reagents and reaction conditions. (i) Glacial acetic acid, sodium acetate, 0 °C. (ii) MeOH, r.t. (iii) MeOH, glacial acetic acid, r.t.
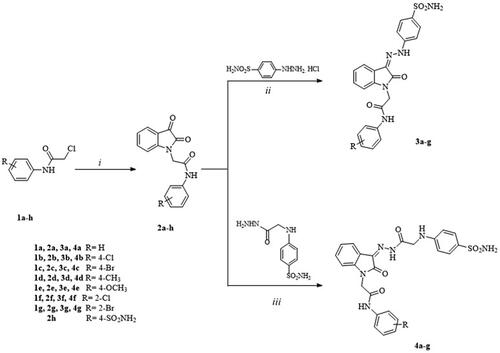
Table 2. Cytotoxic activity and selectivity index of compounds 2h, 3c, and 3d on cancer and normal cell lines
Figure 3. Molecular docking data of 2h on hCAI isoform using PDB ID 3W6H as 2D (a) and 3D (b) presentations showing 2h as green ball and stick model with the formed H-bonds and arene-H were shown in blue and black dotted lines, respectively with their distance in Å highlighting the interaction site. c) The overlaid 3D presentation of 2h (green) and AAZ (magenta) inside the CA I active site.
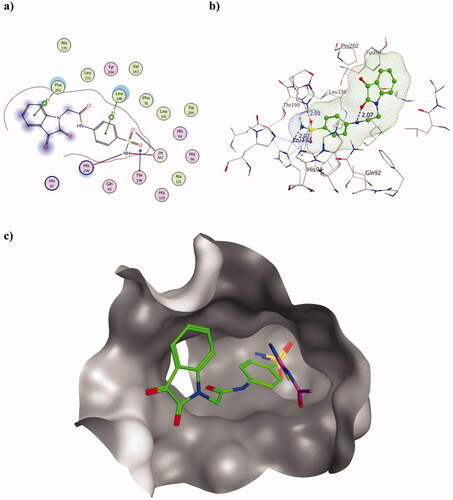
Figure 4. Molecular docking data of 2h on hCA II isoform using PDB ID 3HS4 as 2D (a) and 3D (b) presentations showing 2h as green ball and stick model with the formed H-bonds and arene-H were shown in blue and black dotted lines, respectively with their distance in Å highlighting the interaction site. c) The overlaid 3D presentation of 2h (green) and AAZ (magenta) inside the hCA II active site.
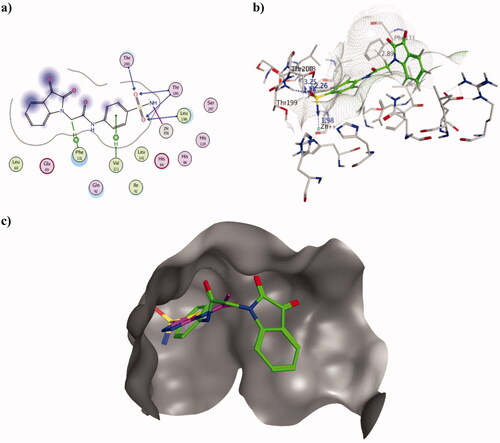
Figure 5. The 2D presentation of 2h molecular docking study interacting with the tumour-associated isoforms hCA IX (a) and XII (b) using PDB ID 3IAI and 1JD0, respectively.
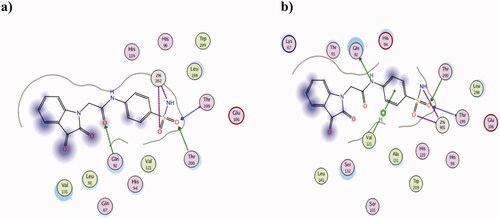
Figure 6. Chemical structures of the reported benzenesulfonamide derivatives as hCA inhibitors included in the 2D-QSAR training set Citation29,Citation30.
Figure 7. Graphical presentation between the experimental and predicative log Ki of hCAIX training set (LOO) validation (a) and test set (b) where the corresponding squared linear coefficient r2 were displayed.
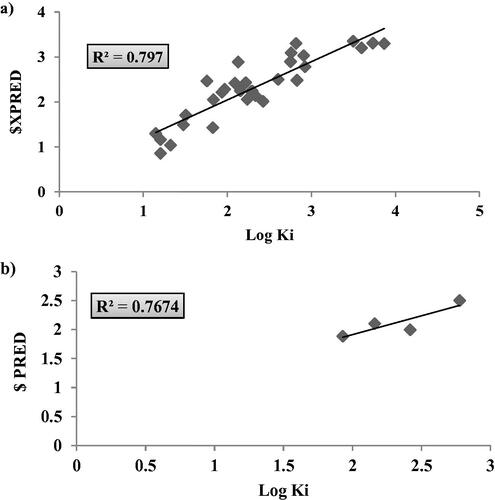
Table 3. The validation data of hCAIX 2D-QSAR model as calculated from LOO method and test set external validation.
Figure 8. Graphical presentation between the experimental and predicative log KI of hCAXII training set (LOO) validation (a) and test set (b) where the corresponding squared linear coefficient r2 were displayed.
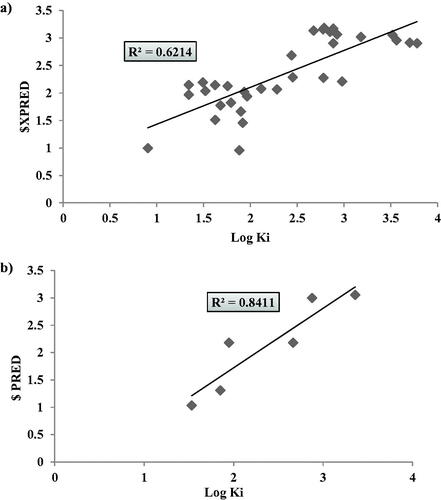
Table 4. The validation data of hCAXII 2D-QSAR model as calculated from LOO method and test set external validation.