Figures & data
Table 1. hCA I-XIV inhibition data with compounds 1–3 by a stopped-flow CO2 hydrase assayCitation35.
Figure 1. Predicted binding mode of acipimox against the crystallographic structure of hCAs in which the Zn(II)-bound water molecule was considered explicitly during docking. A) hCA I; B) hCA II; C) hCA III; D) hCA IV; E) hCA VI; F) hCA VII; G) hCA IX; H) hCA XII; I) hCA XIII; L) hCA XIV. hCAs are shown as green cartoon, residues within 5 Å from acipimox are shown as green lines. Acipimox is shown as cyan sticks, the catalytic Zn(II) ion as a grey sphere, and the Zn(II)-coordinated water molecule as a small red sphere. Polar interactions are highlighted by black dashed lines.
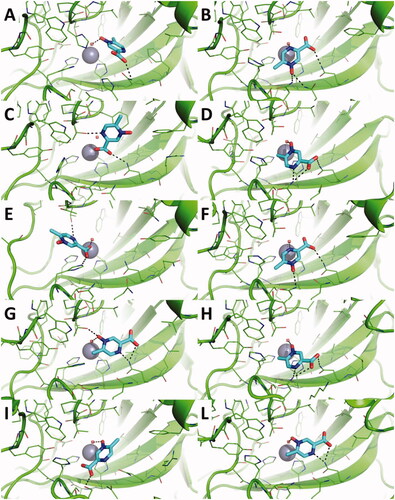
Figure 2. Predicted binding mode of acipimox against the crystallographic structure of hCAs in which the Zn(II)-bound water molecule was not considered in docking simulations. A) hCA I; B) hCA II; C) hCA III; D) hCA IV; E) hCA VI; F) hCA VII; G) hCA IX; H) hCA XII; I) hCA XIII; L) hCA XIV. hCAs are shown as green cartoon, residues within 5 Å from acipimox are shown as green lines. Acipimox is shown as cyan sticks, the catalytic Zn(II) ion as a grey sphere. Polar interactions are highlighted by black dashed lines.
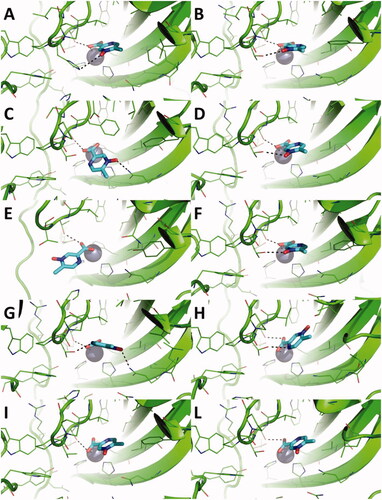
Table 2. GOLD CHEMPLP scores of acipimox against a panel of hCAs.
Figure 3. A) RMSD plot of hCA IX active site residues and acipimox along MD simulation time in each replica carried out from docking poses H-bonded to the Zn(II)-bound water molecule. B) RMSD plot of CA IX active site residues and acipimox along MD simulation time in each replica carried out from docking poses in which acipimox is directly bound to the catalytic Zn(II) ion. C) Plot of the distance between the N-oxide group of acipimox and the catalytic Zn(II) ion of hCA IX along MD time. D) Plot of the distance between the carboxylic group of acipimox and the catalytic Zn(II) ion of hCA IX along MD time. Each replica is shown with different colour (i.e. black, red, green).

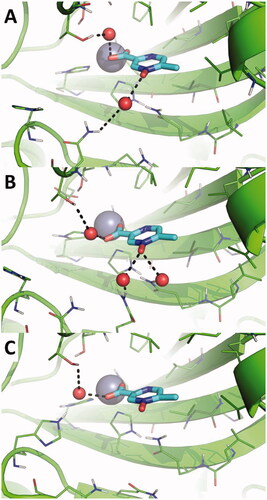
Figure 4. Magnification of the binding mode of acipimox within the catalytic site of hCA IX in the representative frames extracted by cluster analysis from three independent MD replicas. hCA IX is shown as green cartoon, residues within 5 Å from acipimox are shown as green lines. The catalytic Zn(II) ion is shown as a grey sphere, while bridging water molecules are shown as small red spheres. The bulk solvent and non-polar H atoms were removed. Polar interactions are highlighted as black dashed lines.