Figures & data
Scheme 1. Syntheses of the designed pro-inhibitors and the divalent GSH conjugate of BDEA. BDEA: N,N’-butyl-1,4-di-ethacrynic amide; EDEA: N,N’-ethyl-1,2-di-ethacrynic amide; EEAA: N-ethyl ethacrynic amide; GS-BDEA-GS, the divalent product of BDEA
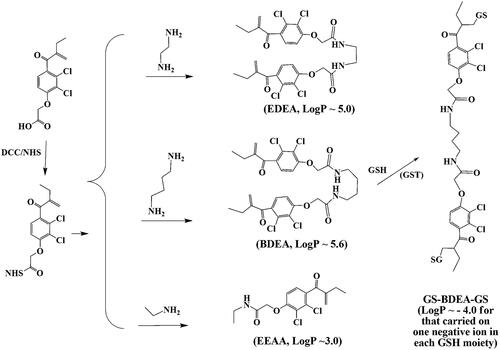
Figure 1. Action properties of pro-inhibitors and the product derived from BDEA. (a) Absorbance change of reaction mixture of GSTA on EEAA at 0.10 mM and GSH at 1.0 mM. Lines 1, 2, 3, 4 indicated absorbance spectra after reaction for indicated periods. Line 5 was for the divalent conjugate from BDEA and GSH. (b) HPLC analysis of the conjugates of BDEA and GSH by absorbance at 265 nm. (1) The reaction mixture of BDEA and GSH but no GSTP for 30 min. (2) The reaction mixture of BDEA, GSH and GSTP for 30 min. (3) The reaction mixture of BDEA, GSH and GSTP for 24 h. (c) ESI-HRMS analysis of mixture of GSH, BDEA and GSTP after reaction for 30 min. (d) Fluorometric titration of the active site of GSTM with BDEA plus GSH in excess. EA-GS: GSH conjugate of EAA. (e) Fluorometric titration of the active site of GSTA with BDEA plus GSH in excess. (f) Structure model of the complex of GSTM and the divalent product of BDEA (pdb code: 5HWL). All data as mean ± SD were repeated trice.
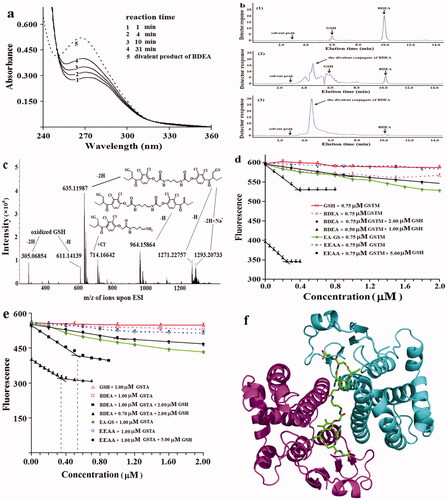
Figure 2. Binding kinetics to GSTM of BDEA and its divalent conjugate. (a) Effects of pre-incubation periods on the inhibition potency on GSTM of the purified divalent conjugate of BDEA. 1 for no pre-incubation; 3 for pre-incubation of 5.0 min with GSTM at 4.0 nM plus 1.0 mM GSH; 2, 4, 5, 6 and 7 indicated pre-incubation for 3.0, 5.0, 10, 20, and 30 min, with GSTM alone at 4.0 nM (without GSH), respectively. (b) Decrease of GSTM activities during reaction with the purified divalent conjugate from BDEA. Final GSTM was 20 nM while the final concentration of the purified divalent conjugate was 100 nM. An aliquot of the reaction mixture was withdrawn at an indicated time and rapidly mixed with an 8-fold volume of a solution of GSH and CDNB for final 1.0 mM to prevent the further formation of the divalence-binding complex and measure the residual activity of GSTM in 2.0 min. (c) Inhibition type of the divalent conjugate from BDEA on GSTM against GSH. From the changes of apparent maximum rates and apparent Michaelis–Menten constants, Kiv and Kik were estimated and the ratio of the larger one of Kiv and Kik to the smaller one was derived to discriminate the inhibition typesCitation35. (d) Inhibition type of the divalent conjugate of BDEA on GSTM against CDNB35. All data were repeated trice, and expressed as mean ± SD.
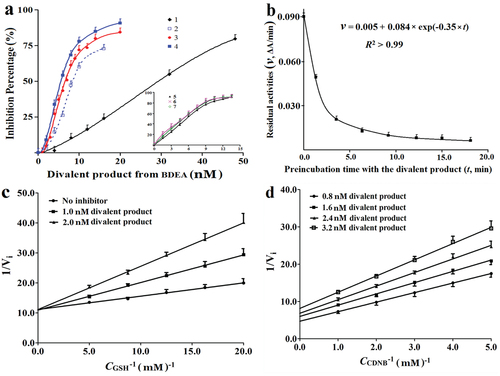
Table 1. Sensitisation of the tested cells to DDP by EDEA and BDEA.
Figure 3. Percents of GST activities in cell lysates susceptible to (a) EDEA and (b) BDEA. (a) The response of residual GST activities to final EDEA concentrations. (b) The response of residual GST activities to final BDEA concentrations. BDEA or EDEA was pre-incubated with GSH in excess plus a cell lysate for 10 min before the addition of CDNB to measure the activity. All data were repeated trice, and expressed as mean ± SD.
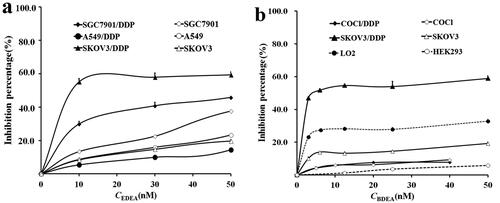
Figure 4. Sensitisation of cancer cells to DDP by BDEA. (a) Sensitisation of SK-OV-3/DDP by BDEA or the divalent conjugate; (b) sensitisation of COC1/DDP by BDEA or the divalent conjugate. The x-axis represented logarithmic molar concentrations of DDP. Cell growth was determined by CCK-8 assay, after cultivation for 72 h since the addition of BDEA or the divalent conjugate, and addition of DDP in 1.0 h later. GS-BDEA-GS: the divalent conjugate of BDEA and GSH. Early and late apoptosis quadrants were being counted. All data were repeated trice, and expressed in mean ± SD.
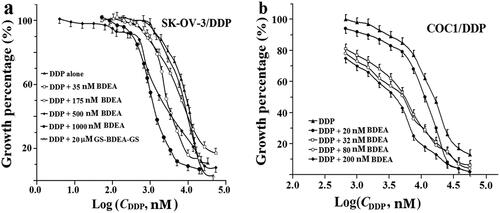
Figure 5. Effects of BDEA plus DDP on apoptosis of the test cells. (a) Effect of BDEA plus DDP on SK-OV-3/DDP. (b) Effect of BDEA plus DDP on COCl/DDP. Early apoptosis and late apoptosis quadrants were being counted for apoptosis rates. All data were repeated trice, and expressed in mean ± SD. One-way ANOVA followed by a Newman–Keuls post hoc test was used for comparison. * p < 0.05.
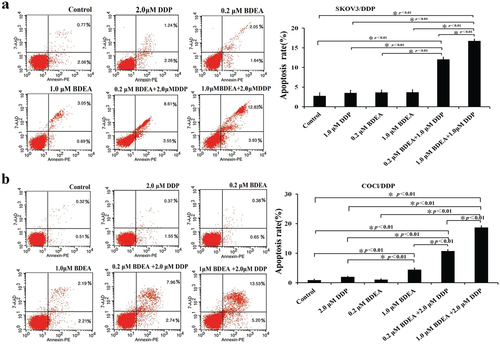
Figure 6. Release of cytochrome c from mitochondria in SK-OV-3/DDP after the treatment with BDEA and DDP. Three treatments utilised the conditions of 1.0 µM DDP, 0.2 µM BDEA and 0.2 µM BDEA +1.0 µM DDP.
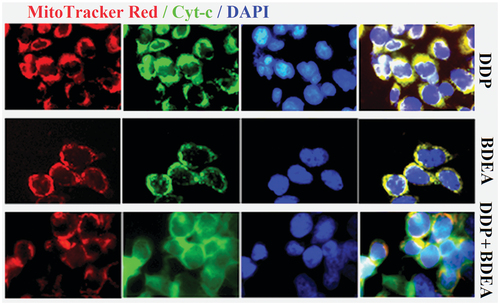
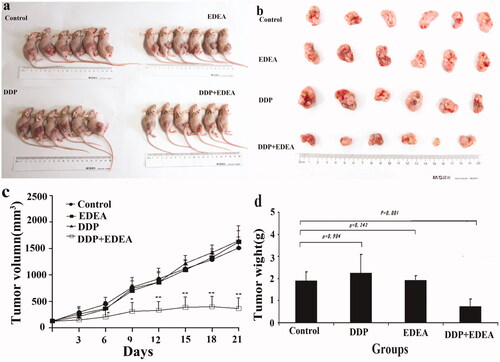
Figure 7. Sensitisation of the xenograft model of SK-OV-3/DDP in nude mice. EDEA at 1.7 mg/kg to DDP at 3.3 mg/kg after continued treatment (once every 3 days). (a) Nude mouse executed three weeks later; (b) photographic views of exercised tumours; (c) comparison of volumes of tumours; (d) comparison of weights of exercised tumours. The photographic images were obtained with CANON DIGITAL 1XUS860IS. All data were repeated trice, and expressed in mean ± SD. One-way ANOVA followed by a Newman–Keuls post hoc test was used for comparison. *p < 0.05.