Figures & data
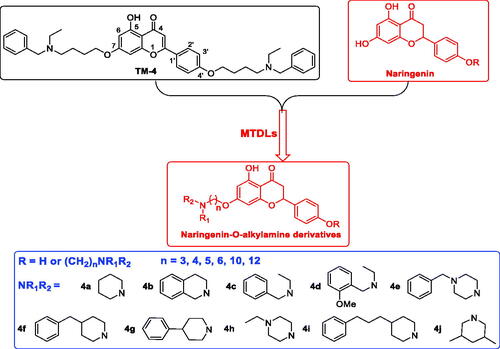
Figure 1. The design strategy of naringenin-O-alkylamine derivatives.
Scheme 1. Synthesis of 7-O-modified naringenin derivatives 5a–5j. Reagents and conditions: (i) Br(CH2)nBr (2b–2f), K2CO3, CH3CN, 65 °C, 8–12 h; (ii) R1R2NH (4a–4f), K2CO3, CH3CN, 65 °C 6–10 h.
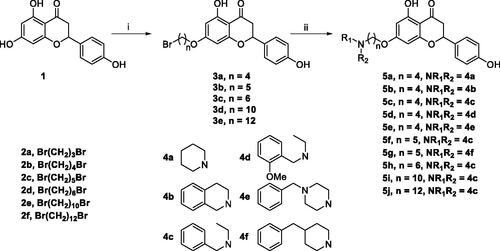
Table 1. The property and yield of 7-O-modified naringenin derivatives.
Scheme 2. Synthesis of 7,4’-O-modified naringenin derivatives 7a–7l. Reagents and conditions: (i) Br(CH2)nBr (2a, 2b and 2d), K2CO3, CH3CN, 65 °C, 10–15 h; (ii) R1R2NH (4a–4h), K2CO3, CH3CN, 65 °C 8–12 h.
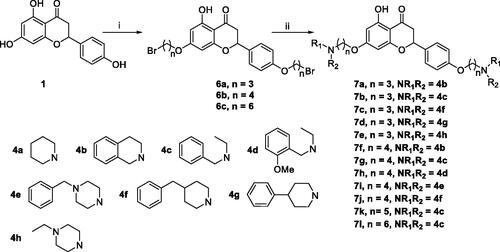
Table 2. The property and yield of 7,4’-O-modified naringenin derivatives 7a–7l.
Scheme 3. Synthesis of 7,4’-O-modified apigenin derivatives 10a–10v. Reagents and conditions: (i) Br(CH2)nBr (2a–2d), K2CO3, CH3CN, 65 °C, 10–15 h; (ii) R1R2NH (4a–4j), K2CO3, CH3CN, 65 °C 8–12 h.
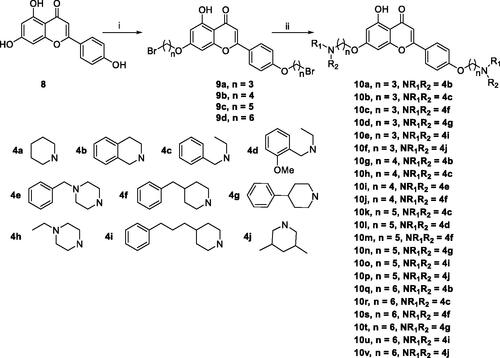
Table 3. The property and yield of 7,4’-O-modified apigenin derivatives 10a–10v.
Table 4. AChE/BuChE inhibitory activities and oxygen radical absorbance capacity (ORAC, Trolox equivalents) by target compounds 5a–5j, 7a–7l, 10a–10v and the positive compounds naringenin, apigenin, genistein and rivastigmine.
Figure 2. (A) huAChE recovery after preincubation of compounds 5f and 7k diluted to 1× or 0.1 × IC50, compared to donepezil diluted, and undiluted inhibition. (B) huAChE recovery of donepezil, 5f and 7k diluted to 0.1 × IC50, were monitored with time at room temperature for 120 min. con. = control, done. = donepezil. Data were expressed as the mean ± SEM by three independent experiments.
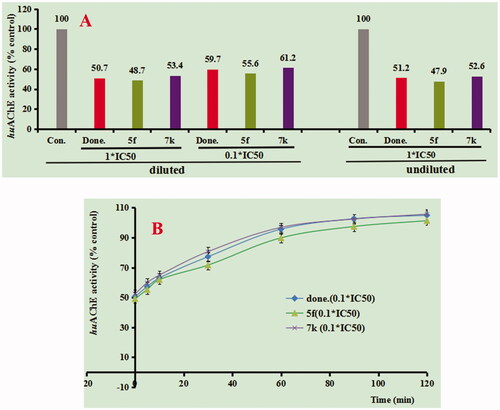
Figure 3. Enzyme kinetic study on the mechanism of huAChE inhibition by compounds 5f and 7k. (A) Overlaid Lineweaver-Burk reciprocal plots of AChE initial velocity at increasing acetylthiocholine concentration in the absence and in the presence of 5f are displayed. (B) Representing the plots of slope versus the concentration of 5f for determining the inhibition constants Ki. (C) Overlaid Lineweaver-Burk reciprocal plots of AChE initial velocity at increasing acetylthiocholine concentration in the absence and in the presence of 7k are displayed. (D) Representing the plots of slope versus the concentration of 7k for determining the inhibition constants Ki.
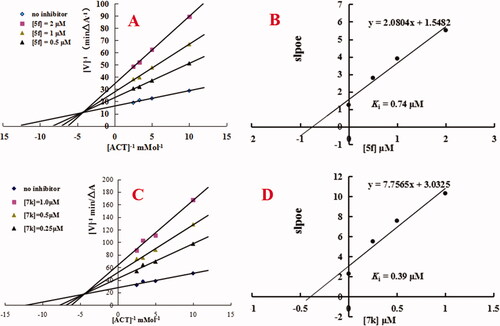
Figure 4. (A) Compound 5f (green stick) acted on residues in the binding site of huAChE (PDB code: 4ey4). (B) 2 D docking model of 5f with huAChE. (C) 3 D docking model of 5f with huAChE.
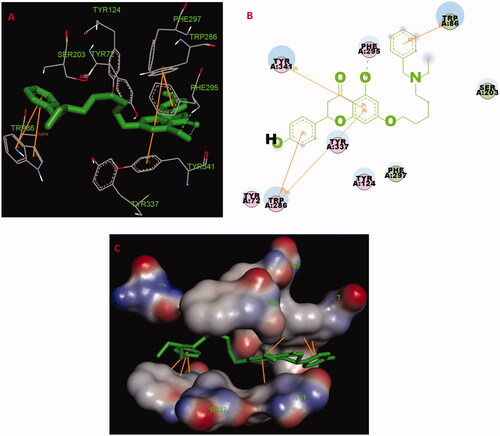
Figure 5. (A) Compound 7k (green stick) acted on residues in the binding site of huAChE (PDB code: 4ey4). (B) 2 D docking model of 7k with huAChE. (C) 3 D docking model of 7k with huAChE.
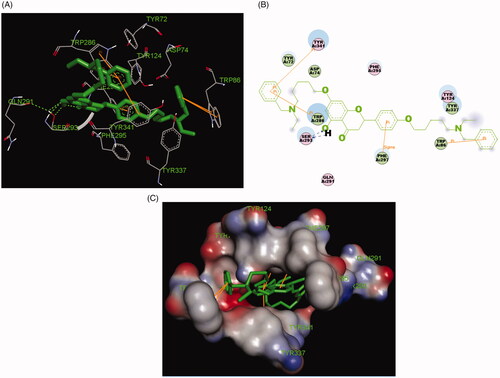
Figure 6. RMSD analysis of compounds 5f (black stick) and 7k (red stick).
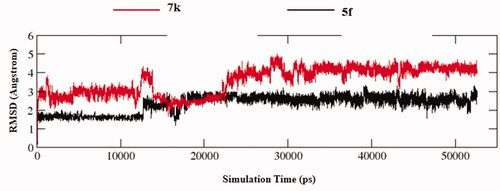
Figure 7. (A) The docking model for 5f into the protein crystal structure of huAChE (PDB code: 4ey4). (B) The docking model for 7k into the protein crystal structure of huAChE (PDB code: 4ey4).
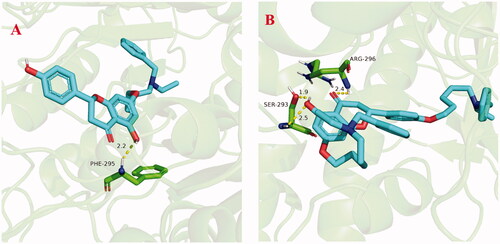
Table 5. The binding free energy and components of 5f and 7k (kcal/mol)
Table 6. The data of propidium iodide displacement assay towards compounds 5f, 7k and doneipezil.
Table 7. Effects on self-induced/Cu2+-induced Aβ1–42 aggregation by compounds 5f, 7k and curcumin.
Figure 8. (A) The UV spectrum of compound 5f (37.5 μM) alone or in the presence of CuCl2, FeSO4, ZnCl2 and AlCl3 (37.5 μM) in methanol; (B) Determination of the stoichiometry of complex-Cu2+ by using molar ratio method at 386 nM.
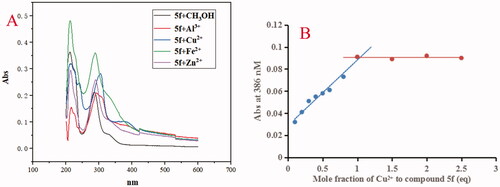
Figure 9. (A) The UV spectrum of compound 7k (37.5 μM) alone or in the presence of CuCl2, FeSO4, ZnCl2 and AlCl3 (37.5 μM) in methanol; (B) Determination of the stoichiometry of complex-Cu2+ by using molar ratio method at 385 nM. The final concentration of 7k was 37.5 μM, and the final concentration of Cu2+ ranged from 3.75 to 93.75 μM.
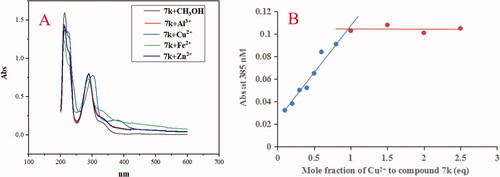
Figure 10. TEM images of Aβ species from inhibition experiments.
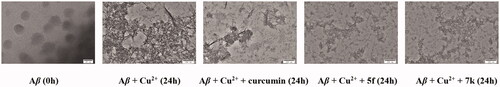
Table 8. The predictive permeation of compounds 5f and 7k by PAMPA-BBB assay.
Figure 11. Cell viability was tested by MTT assay. (A) Cytotoxicity of compounds 5f and 7k on PC12 cells. (B) Attenuation of H2O2-induced PC12 cell injury by compounds 5f and 7k. values were expressed as mean ± SD by three independent experiments. ##p < 0.01 vs control; **p < 0.01, *p < 0.05 vs H2O2 group.
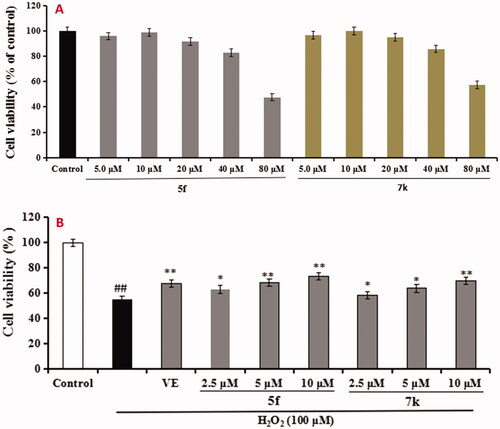
Figure 12. The cell viability of compounds 5f and 7k on the BV-2 cells was determined using MTT assay. The data are expressed as the mean ± SD by three independent experiments.
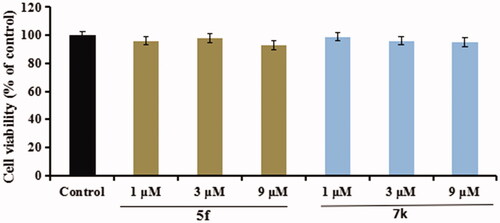
Figure 13. Effects of compounds 5f and 7k on NO release in BV-2 cells and LPS-stimulated BV-2 cells. Data were expressed as mean ± SD through three independent experiments. con. = control; mod. = model. ##p < 0.01 vs control; ***p < 0.01, **p < 0.01, *p < 0.05 vs LPS-induced group.
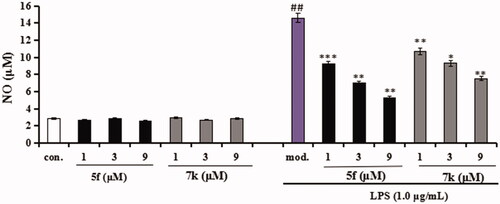
Figure 14. Effects of compounds 5f and 7k on TNF-α release in LPS-stimulated BV-2 cells. Data were expressed as mean ± SD through three independent experiments. ##p < 0.01 vs control; ***p < 0.01, **p < 0.01, *p < 0.05 vs LPS-induced group.
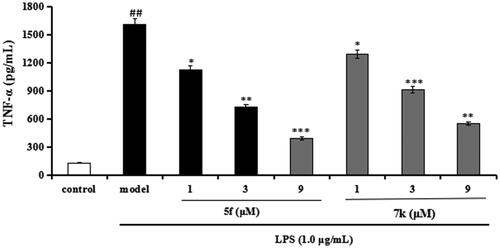
Table 9. Theoretical prediction of the ADME properties of compounds 5f and 7k.
Figure 15. (A) The cell viability of LO2 cell by compound 5f. (B) The protective effect of compound 5f on H2O2-induced hepatic injury, ##p < 0.01 vs control; **p < 0.01, *p < 0.05 vs model group.
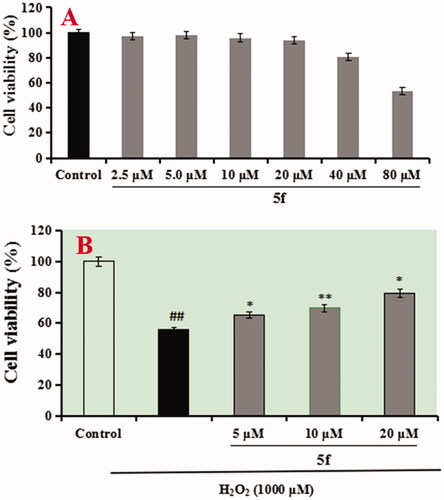
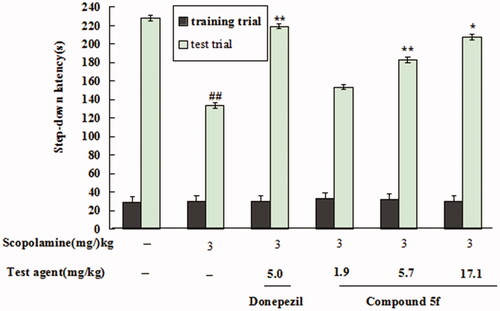
Figure 16. Effect of compound 5f (1.9, 5.7 and 17.1 mg/kg) or donepezil (5.0 mg/kg) on scopolamine-induced memory impairment through the step-down passive avoidance assay. Values are expressed as the mean ± SEM (n = 6). ##p < 0.01 vs untreated group. *p < 0.05 and **p < 0.01 vs scopolamine-treated model group.