Figures & data
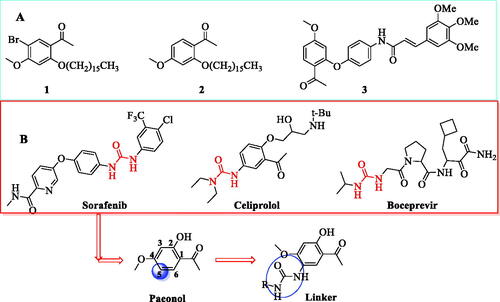
Figure 1. The process of design and analysis. (A) Some of paeonol derivatives; (B) Urea linker as fragment of modification in this study.
Scheme 1. Synthesis of compounds A1−A14, B1−B13, C1−C7 and D1−D4. Reagents and conditions: (i) HNO3, CH3COOH, rt to 0 °C, 3h; (ii) H2, Pd/C, methanol, rt, overnight; (iii) amines, triphosgene, N, N-diisopropylethylamine, DCM, rt, 3 h.
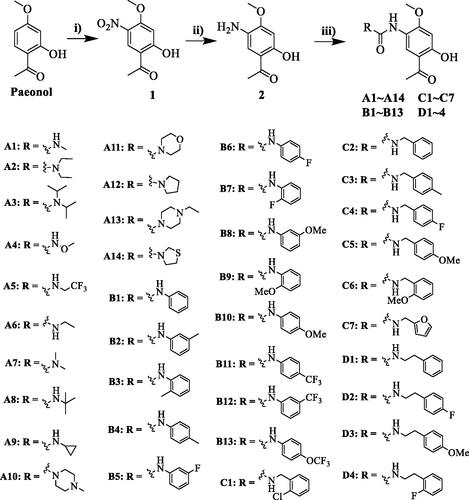
Figure 2. Cytotoxic evaluation of all compounds in RAW264.7 cells (A), LO2 (B) and HaCaT cells (C). Inhibition of NO production by in RAW264.7 cells (D). Cell viability of all compounds were determined by MTT at 100 μM for 24 h; RAW264.7 cells were pre-treated with compounds (10 μM) for 1 h, incubated with LPS (0.5 μg/mL) for 24 h, NO production was measured using Griess Reagent assay. Paeonol (10 μM) and celecoxib (10 μM) are positive compound. The results are expressed as mean ± SD of three experiments. The concentration of DMSO is 1 0−8 M. ***p < 0.001, **p < 0.01, *p < 0.05 vs LPS group.
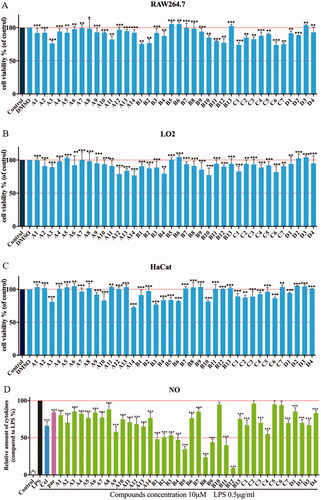
Table 1. Inhibitory effects of compounds A1−A14, B1−B13, C1−C7 and D1−D4 against NO production and cytotoxicity against RAW264.7 and LO2 cellsa
Figure 3. Inhibition of compound B12 on expression of pro-inflammatory mediators in LPS-stimulated RAW264.7 cells. RAW264.7 cells were pre-treated with compound B12 at 2.5, 5, 10 µM for 1 h, incubated with LPS (0.5 mg/mL) for 24 h. iNOS, COX-2 and β-actin were detected by Western blot. ###p < 0.001 compared with Control, ***p < 0.001 compared with LPS-stimulated cells; The blots are shown examples of three separate experiments.
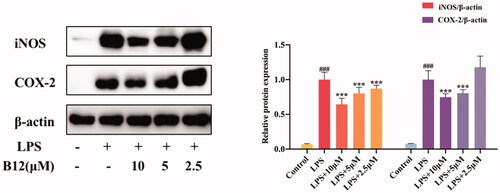
Figure 4. Compound B12 inhibit hyperproliferation in LPS-stimulated HaCaT cells. HaCaT cells were pre-treated with compound B12 at concentrations gradient for 6 h, incubated with LPS (100 g/mL) for 24 h. Cell viability were detected by MTT. ###p < 0.001 compared with Control, ***p < 0.001 compared with LPS-stimulated cells; The cell viability was shown examples of three separate experiments.
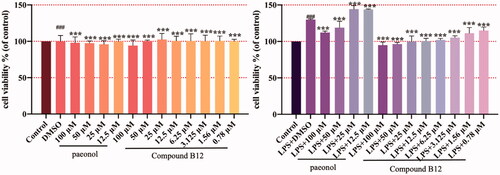
Figure 5. CETSA detect thermal stability of TOPK in presence of compound B12.
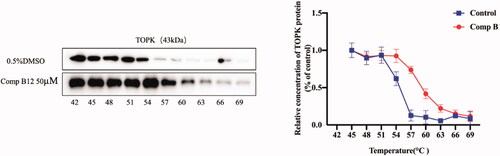
Figure 6. Compound B12 suppressed LPS-induced MAPK and NF-κB activation. (A) Compound B12 inhibited phosphorylation of TOPK. (B) Compound B12 inhibited phosphorylation of JNΚ and p38. (C) Compound B12 inhibited phosphorylation p65. Cells were treated with LPS (0.5 μg/mL) for 30 min. The results were showed as means ± SD (n = 3). ###p < 0.001 compared with LPS unstimulated cells; ***p < 0.001 compare with LPS-stimulated cells.
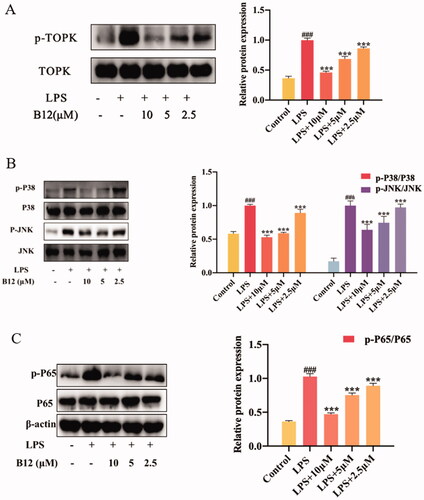
Figure 7. Compound B12 dose-dependently suppressed SUV-induced MAPK and downstream proteins activation. (A) Compound B12 inhibited phosphorylation of JNΚ and p38. (B) Compound B12 inhibited phosphorylation of STAT3 and H2AX. Cells were treated with SUV (40 kJ/m2) for 30 min. The results were showed as means ± SD (n = 3) of at least three independent experiments. ###p < 0.001 compared with LPS unstimulated cells; ***p < 0.001 compare with LPS-stimulated cells.
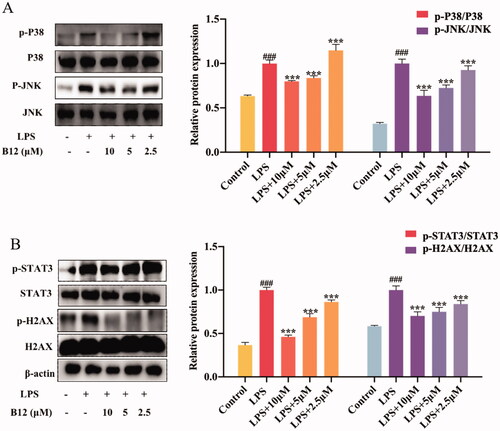
Figure 8. (A) Illustration of mouse psoriasis model induced by IMQ; (B) PASI and effect of compound B12 on back skin of mice induced by IMQ (x ± s, n = 6); (C) Represent phenotypic pictures of back skins in each group; (D) H&E staining of skin tissues from mice in each group. Data were shown as mean ± SEM; n = 6 mice per group; *p < 0.05, **p < 0.01, and ***p < 0.001, compared with vehicle group.
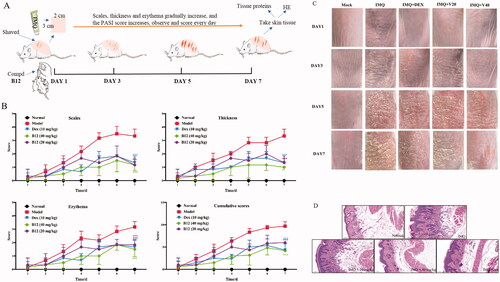
Figure 9. Compound B12 inhibited expression of p-STAT3, p-TOPK, TOPK, p-p38, p-JNKs, PCNA, p-H2AX in mouse skin tissues. The results were showed as means ± SD (n = 3) of at least three independent experiments.
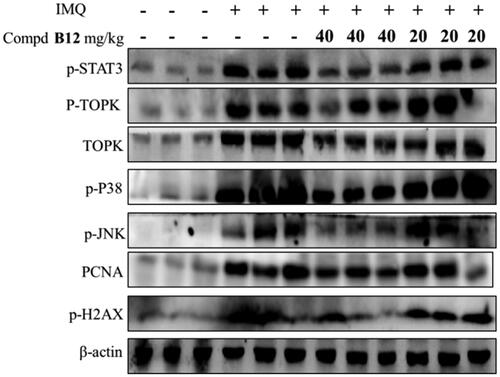
Table 2. Metabolic stability in human liver microsomes.
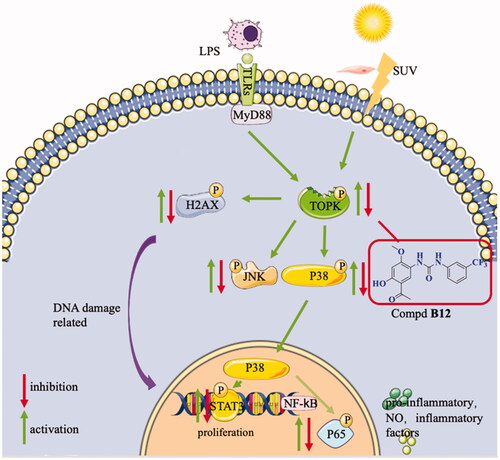
Figure 10. Proposed mechanisms of compound B12 for anti-inflammatory.