Figures & data
Figure 1. Trypanothione biosynthesis/functions and inhibitors. Trypanothione synthetase (TryS) catalyses the stepwise addition of one or two glutathione molecules to spermidine or monoglutathionylspermidine (Gsp) to form trypanothione. In contrast, monoglutathionylspermidine synthetase (GspS) is able to add a single glutathione molecule to spermidine to form monoglutathionylspermidine (Gsp). The biosynthetic reactions are ATP-dependent. The structure and IC50 value of the most potent TryS inhibitors (Tc: T. cruzi, Lm: L. major, Tb: T. brucei and Li: L. infantum) emerging from a large (phenyl-indazole, -tetrazole and -thiazole) or drug-focused (polyamine-phophinopeptide and paullone) screenings are shown.
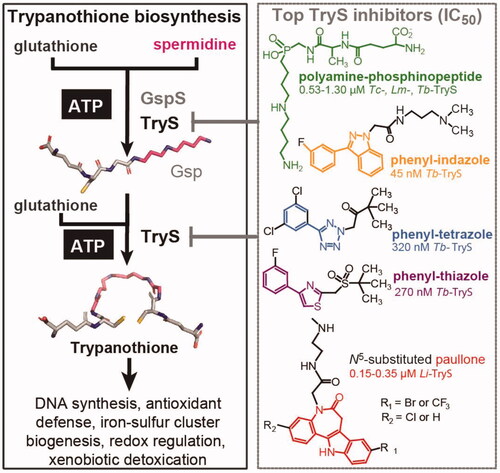
Figure 2. HTS screening against Trypanosoma brucei Trypanothione synthetase (TbTryS). (A) Pilot screening. An in-house library of 4210 compounds was tested at 25 μM, and in duplicate in two independent experiments (indicated as Set 1 and Set 2), for their inhibitory activity against TbTryS. Lineal regression fitting for TryS inhibition (%) from both sets yielded a R2 value of 0.96. Twenty compounds displayed ≥ 70% enzyme inhibition (blue dots), which corresponds to a hit ratio of 0.47%. (B) Large screening. A commercial library of 47,414 small compounds (ENAMINE) was tested at 25 μM for their inhibitory activity against TbTryS. Sixty-two compounds displayed ≥ 60% enzyme inhibition (blue dots), which corresponds to a hit ratio of 0.13%.
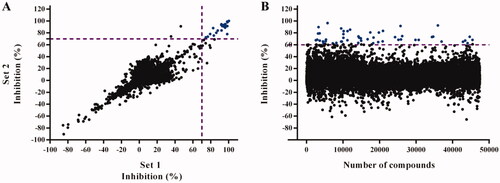
Table 1. Hit compounds targeting trypanothione synthetase (TryS) inhibition.
Figure 3. T. brucei TryS hit compounds from the ENAMINE library. CPA: carboxy piperidine amide derivatives, AMTPh: amide methylene thiazole phenyl derivatives, AMPh: amide methylene phenyl derivatives and singleton: 17, the most potent singleton with its adamantine moiety highlighted in orange. The scaffolds or moiety of interest are highlighted in different bold colours. The EC50 (bloodstream T. brucei) and selectivity index (value in brackets, reference cell line: human macrophages, THP-1) are shown only for compounds with anti-proliferative action against T. brucei at concentrations ≤25 µM. All the errors are expressed as one SD and the compounds’ molecular mass in Daltons.
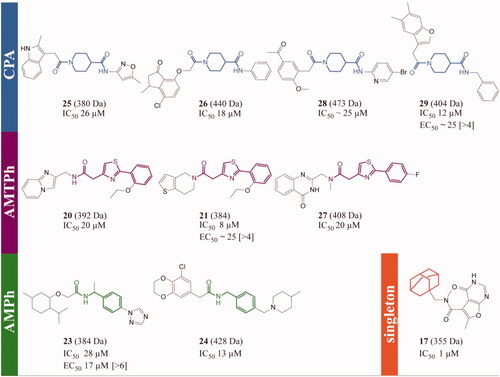
Figure 4. Most prominent TryS hits from the in-house library tested against the clinically relevant forms of major trypanosomatid species. Compound’s structure, molecular weight (in Daltons) and activity (IC50 and EC50 are in µM units, and the selectivity index is referred to human macrophages and shown within brackets). The biodata is highlighted in blue for T. brucei, violet for T. cruzi and orange for Li-TryS or L. donovani.
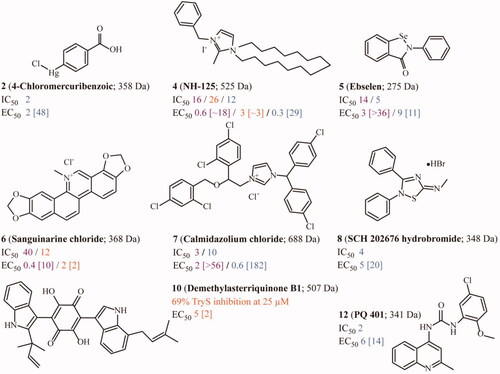
Table 2. Biological activity of TryS inhibitors against the infective stage of different trypanosomatids (bloodstream T. brucei and intracellular amastigotes of T. cruzi and L. donovani) and mammalian (host) cells.
Figure 5. Correlation between on-target (in vitro) and anti-trypanosomatid (in vivo) activity for selected TryS hits. For the most potent inhibitors of TryS from different trypanosomatid species, the IC50 and EC50 values are plotted. Compounds showing different correlations for the quotient IC50/EC50 are shown in different colours (blue: IC50 > EC50, red: IC50 ≈ EC50 and black: IC50 < EC50). The dashed line denotes a correlation for IC50/EC50 = 1. Compounds inside the grey box are hits against the corresponding TryS (IC50 ≤ 25 μM) and parasite species (EC50 ≤ 10 μM). Those hits that, in addition, present a selectivity index > 10 are highlighted with * in the plot’s legend. The results are shown for (A) Trypanosoma brucei TryS and bloodstream parasites, (B) Trypanosoma cruzi TryS and amastigote stage and (C) Leishmania infantum TryS and amastigote stage.
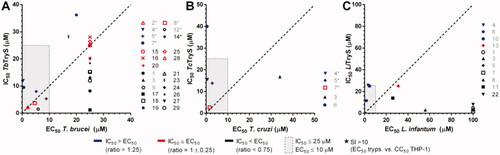
Figure 6. Intracellular redox status of bloodstream T. b. brucei treated with TryS’s inhibitors. (A) The bloodstream form of a redox reporter cell line of T. brucei was treated for 4 h with the most potent compounds targeting TryS and T. brucei added at concentrations corresponding to 1× or 2× their EC50 (). The thiol-specific oxidant Diamide (D, 250 µM for 20 min) was included as control. (B) Samples treated with compounds exerting significant changes in biosensor fluorescence, namely 4 and 5 both at 2 × EC50, were treated for 20 min with menadione (M, 250 µM) and DTT (1 mM) to confirm the redox basis of changes observed, respectively. In both plots, the values corresponding to the % reduction of the biosensor are normalised against conditions yielding full biosensor reduction (DTT 1 mM, 20 min) and oxidation (menadione 250 µM for 20 min) in parasites grown in medium containing DMSO 1% v/v.
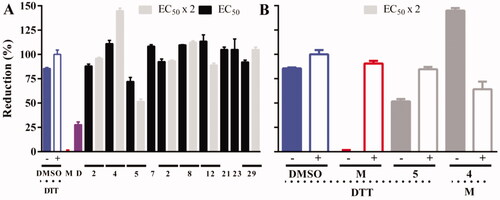
Table 3. Mode of inhibition of TbTryS by Ebselen.
Figure 7. MS/MS spectra of peptides modified by Ebselen. Representative MS/MS spectra for the 3 peptide sequences covalently modified by Ebselen (A) SIDGNLFCGFK (m/z = 738.2831, z = 2), (B) YQCVEFAR (m/z = 645.7306, z = 2) and (C) ELYLNCVR (m/z = 642.7532, z = 2). The Ebselen modification reporter ions (an intense signal of m/z = 275.9938 corresponding to protonated Ebselen ([Eb + H]+) and the signal of the two most intense fragmentation products of m/z = 196.0751 and 183.9417) are present in all spectra (Eb frag+). Peaks are assigned to the y and b series of native sequence; +Eb indicates those fragment ions containing the +274.985 modification. Phe, Lys and Tyr indicate the immoniun ions of the respective amino acids. Eb: Ebselen.
![Figure 7. MS/MS spectra of peptides modified by Ebselen. Representative MS/MS spectra for the 3 peptide sequences covalently modified by Ebselen (A) SIDGNLFCGFK (m/z = 738.2831, z = 2), (B) YQCVEFAR (m/z = 645.7306, z = 2) and (C) ELYLNCVR (m/z = 642.7532, z = 2). The Ebselen modification reporter ions (an intense signal of m/z = 275.9938 corresponding to protonated Ebselen ([Eb + H]+) and the signal of the two most intense fragmentation products of m/z = 196.0751 and 183.9417) are present in all spectra (Eb frag+). Peaks are assigned to the y and b series of native sequence; +Eb indicates those fragment ions containing the +274.985 modification. Phe, Lys and Tyr indicate the immoniun ions of the respective amino acids. Eb: Ebselen.](/cms/asset/c76312b8-411b-403e-8542-8311e5e8ca5c/ienz_a_2045590_f0007_c.jpg)
Figure 8. Molecular model for allosteric inhibition of TryS by Ebselen. (A) Amino acid sequence of TbTryS highlighting the N-terminal amidase domain (black box), the C-terminal synthetase domain (blue box) and the linker region (white bold letters on green background). The cysteine residues (red background: conserved in Tc- and Li-TryS, black background: conserved in TcTryS, grey background: unique to TbTryS) that were found modified by Ebselen (asterisk) and fulfils a role in amidase catalytic activity (dot) are highlighted. The region harbouring structural elements with highly-conserved residues (in white bold letters) relevant for the catalytic activity of the synthetase domain and forming a hydrophobic pocket (italics) in the vicinity of Cys277 is highlighted in magenta background. The strictly conserved serine residue acting as nucleophilic attack facilitator for conjugation of the polyamine moiety (SP or Gsp) to GSH is shown in yellow background. (B) Cartoon representation of L. major TryS 3D structure (PDB 2VOB) showing the conserved cysteine residues from the amidase (grey cartoon, Cys60) and the synthetase (blue cartoon, Cys277) domain that bind Ebselen covalently in TbTryS. The linker region is shown in green and the substrates bound to the synthetase active site are shown in sticks. (C) Location of the cysteine from the synthetase domain modified by Ebselen (Cys 277 in LiTryS and Cys270 in TbTryS). Hydrophobic residues (Phe330, Phe332 and Phe334) in the vicinity of Cys277 and forming part of structural elements harbouring several residues relevant for catalytic activity are coloured magenta. (D) Synthetase active site with bound substrates and strictly conserved residues relevant for catalysis are shown in magenta (Arg329, Asp331 and Asn347) and yellow (Ser352) coloured sticks. The network of hydrogen bonds and electrostatic interactions between these residues and with substrates is shown with dashed lines.
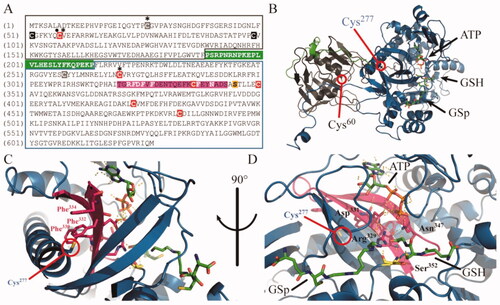
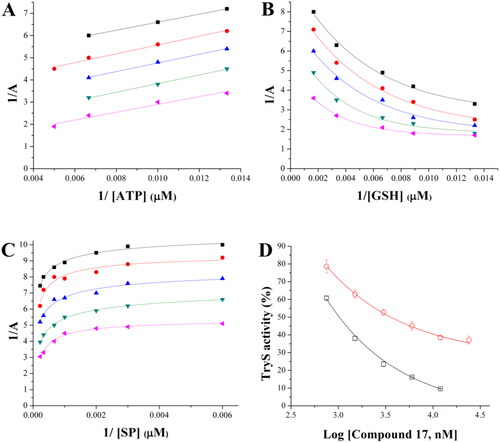
Figure 9. Inhibition mechanism of 17 towards TbTryS. Lineweaver–Burk plots are shown for the varying substrate: (A) ATP, (B) glutathione (GSH) and (C) spermidine (SP). The kinetic analysis was performed at different inhibitors (black square: 12 µM, red circle: 6 µM, blue triangle: 3 µM, green inverted triangle: 1.5 µM, and pink triangle: 0.75 µM) and single substrate concentrations while maintaining fixed the concentration of the co-substrates (4.5 mM for SP, 200 µM for ATP and 150 µM for GSH). Enzyme velocity was measured using an end-point assay (see the section 1.3 Materials and methods for details). (D) TbTryS activity determined at different inhibitor concentrations and saturating concentrations of all substrates (SP: black empty square and Gsp: red empty circle).