
Figures & data
Figure 1. Anti-tumour drugs in the market.
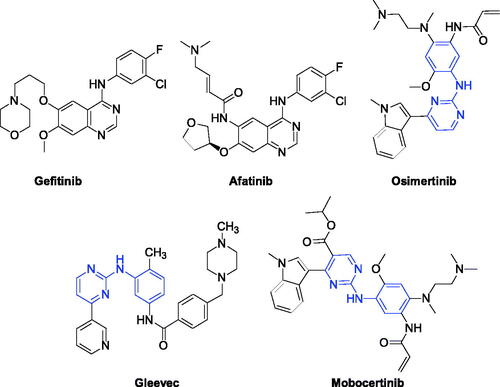
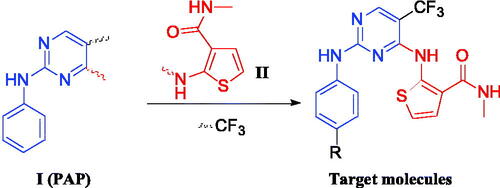
Figure 2. The design strategy of EGFR inhibitors.
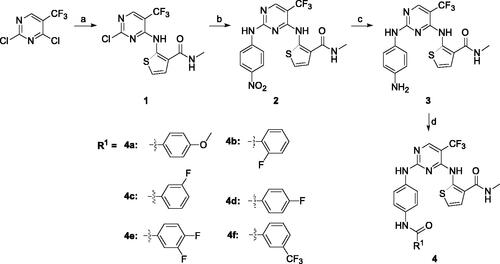
Scheme 1. Synthetic route of target compounds 4a–4f. Reagents and conditions: (a) 2-amino-N-methylthiophene-3-carboxamide, NaHCO3, EtOH, rt, overnight, 40% yield; (b) 4-nitroaniline, TFA, TFE, reflux, overnight, 43% yield; (c) Pd/C, MeOH, rt, 24 h, 35% yield; (d) corresponding acid, HATU, DIEA, DMF, rt, 12 h, 38%–46% yield.
Scheme 2. Synthetic route of target compounds 6 and 8. Reagents and conditions: (a) dimethyl squarate, DIEA, DMF, rt, overnight, 57% yield; (b) corresponding amine, DIEA, DMF, 80 °C, 12 h, 38%–48% yield; (c) hydrogen chloride-ethyl acetate solution, 79% yield; (d) corresponding acid, HATU, DIEA, DMF, rt, overnight, 42%–66% yield.
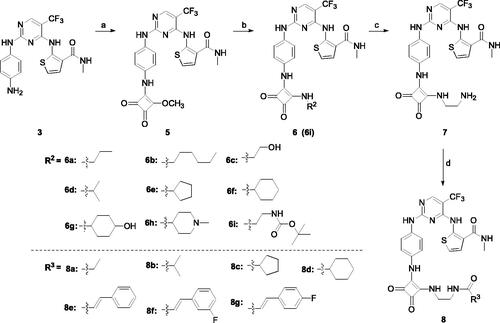
Table 1. In vitro activities of target compounds for EGFRwt-TK and cancer cell linesa
Table 2. IC50 values for EGFRwt
Figure 3. Compound 4c induced A549 cell apoptosis in Annexin V-FITC assay. (A) Density plots were obtained by flow cytometry in the presence of different concentrations (1 μM, 5 μM and 10 μM); Gefitinib was used as the positive control. (B) Total apoptotic cells (%) at various concentrations of 4c and Gefitinib.
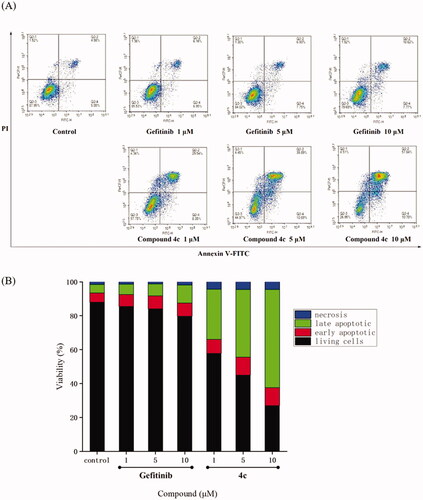
Figure 4. Cell cycle distribution of compound 4c and Gefitinib against A549 was studied by flow cytometry. (A) A549 cells were cultured in the presence of different concentrations of 4c (1 μM, 5 μM and 10 μM) or Gefitinib (1 μM, 5 μM and 10 μM) for 48 h, harvested, fixed, and labelled with PI, then analysed by FACS. Percentage of cells in G0/G1, S and G2/M phases are indicated. (B) Profiles obtained by FACS. The percentages for different phases of the cell cycle were illustrated in the histogram.
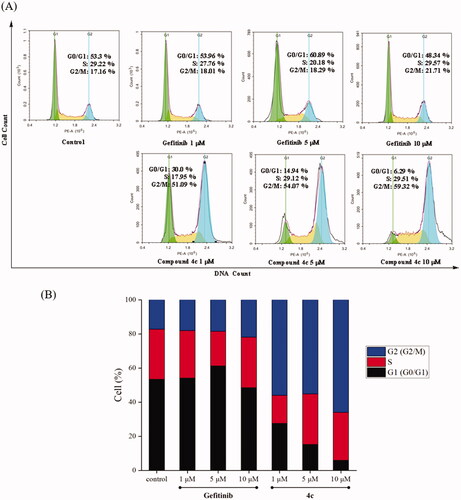
Figure 5. Docking structures of compound 4c. (a) Binding configuration of compounds 4c with EGFRwt (PDB: 1M17); (b) The 2 D model of compound 4c bound to EGFRwt (PDB: 1M17).
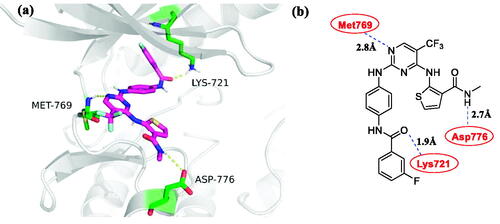
Table 3. Predicted ADMET properties of the target compounds.