Figures & data
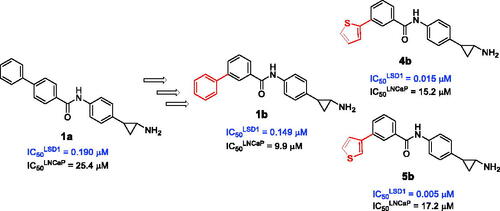
Figure 1. TCP-based LSD1 inhibitors disclosed by us.
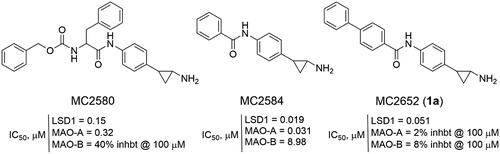
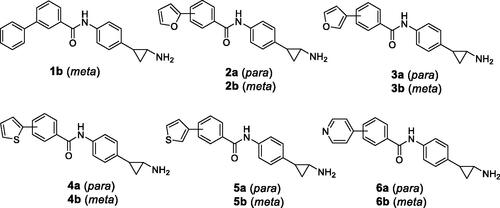
Figure 2. Novel TCP-based analogs as LSD1 inhibitors 1 b-6.
Scheme 1. Synthesis of the N-(4-(2-aminocyclopropyl)phenyl)-(hetero)aryl-4- and 3-carboxamides 1 b-6. Reagents and conditions: (a) PyBop, Et3N, dry DMF, N2 atmosphere, overnight, rt. (b) 4 N HCl, dry dioxane/THF, overnight, rt.
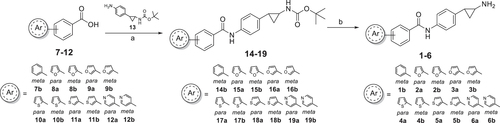
Figure 3. Representative samples of thermal shifts by ThermoFAD assay (A) and FAD spectral bleaching (B) for selected compounds. LC305 is the code for the LSD1-CoREST complex.
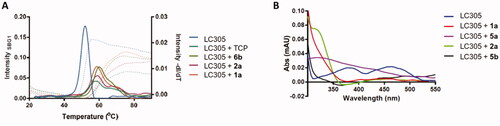
Table 1. ThermoFAD assay and inhibition values (IC50 values) of 1 b-6 vs LSD1-CoREST complex.
Figure 4. Inhibition curves of 1 b-6 against LSD1-CoREST. Compound 1a has been reported for comparison purpose.
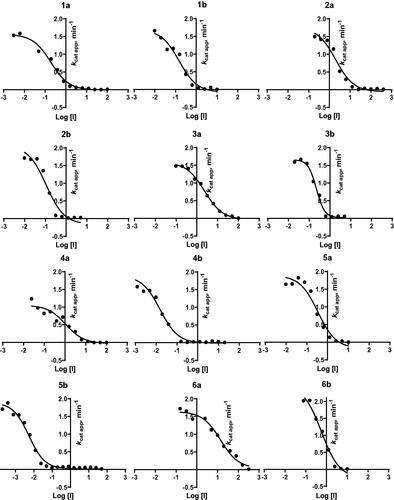
Table 2. Anti-MAO activities of 1 b-6.a
Table 3. LSD1 selectivity over MAOs.
Table 4. Effects of 1a,b, 2 b, 3 b, 4 b, and 5a,b on cell viability in U937 cells after 48 and 72 h of treatment.
Table 5. Effects of 1a,b, 2 b, 3 b, 4 b, and 5a,b on cell viability in LNCaP cells after 48 and 72 h of treatment.
Table 6. IC50 values of 1a,b, 2 b, 3 b, 4 b, and 5a,b in LNCaP cells. For comparison, the IC50 (72 h) of the selective MAO-A inhibitor clorgyline has been added.
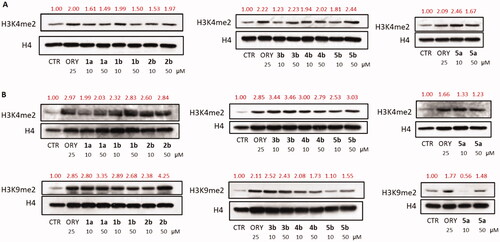
Figure 5. Western blot analyses of the H3K4me2 levels in U937 cells (A) and of H3K4me2 and H3K9me2 levels in LNCaP cells (B).