Figures & data
Figure 1. Schematic representation of the (A) “three-tails” approach for the design of zinc-binding CAIs. (B) Binding mode of a Three-Tailed Inhibitor (TTIs).
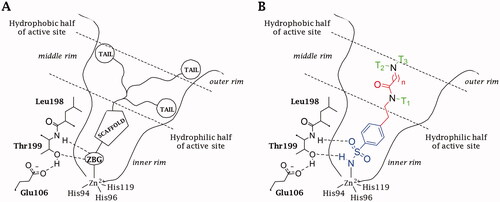
Table 1. Inhibition data of human CA isoforms I, II, IV, IX, and XII with sulphonamides 19–50 reported here and the standard sulphonamide inhibitor acetazolamide (AAZ) by a stopped-flow CO2 hydrase assayCitation41.
Figure 2. Cartoon representation of A) hCA IICitation36 and B) hCA IX-mimic overlayed on a surface view with zinc (magenta sphere) and His94, His96, and His119 (sticks) shown in the active site with inhibitors bound. 34 (purple), 41 (yellow), 42 (cyan), 46 (green), and 48 (orange) are shown in both panels.
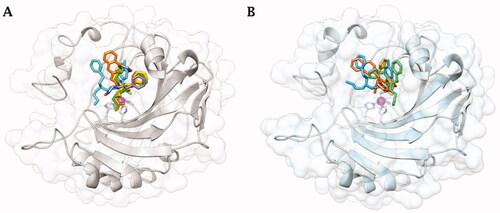
Figure 3. Electron density of A) 41, B) 42, C) 46, and D) 48 in hCA IX-mimic active site with a sigma of 1.0.
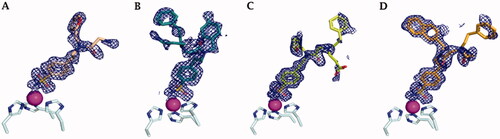
Figure 4. X-ray crystallography: active site view of hCA IX-mimic in adduct with A) no inhibitor, B) 41, C) 42, D) 46, and E) 48. H-bonds are depicted as black dashed lines. Water molecules involved in water-bridged H-bonds are shown as red spheres. Amino acids are labelled with one letter symbols: D, Asp; E, Glu; F, Phe; H, His; I, Ile; L, Leu; N, Asn; P, Pro; Q, Gln; T, Thr; V, Val; W, Trp.
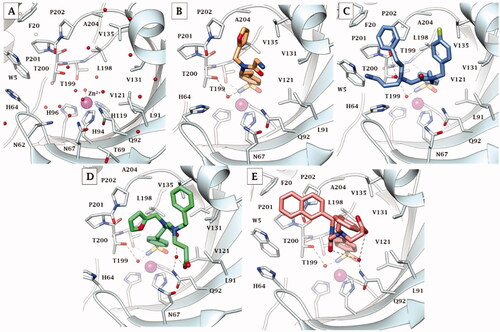
Figure 5. Superimposition of the crystallographic binding orientations adopted in the active site of hCA II (grey) [Citation36] and hCA IX-mimic (light blue) for A) 41, B) 42, C) 46, and D) 48. Colours are as in of Bonardi et al. [Citation36] and .
![Figure 5. Superimposition of the crystallographic binding orientations adopted in the active site of hCA II (grey) [Citation36] and hCA IX-mimic (light blue) for A) 41, B) 42, C) 46, and D) 48. Colours are as in Figure 6 of Bonardi et al. [Citation36] and Figure 4.](/cms/asset/c7f0ca1a-048a-45a3-89d5-f31d36cc3cc3/ienz_a_2053526_f0005_c.jpg)
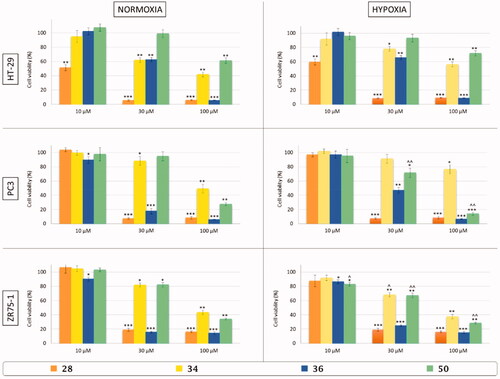
Figure 6. In vitro cell viability assay of colon adenocarcinoma (HT-29), prostate adenocarcinoma (PC3), and breast cancer (ZR75-1) cell lines after 48 h of treatment with three different concentrations (10, 30, and 100 µM) of three-tailed inhibitors 28 (orange), 34 (yellow), 36 (blue), and 50 (green) in normoxic (21% O2) and hypoxic (3% O2) conditions. Control cells are arbitrarly set at 100% and results are expressed as the mean ± SEM of three experiments. One-way ANOVA was performed followed by a Bonferroni’s significant difference procedure. *p < .05, **p < .01, and ***p < .001 vs. control; ∧p < .05 and ∧∧p < .01 vs. normoxia.