Figures & data
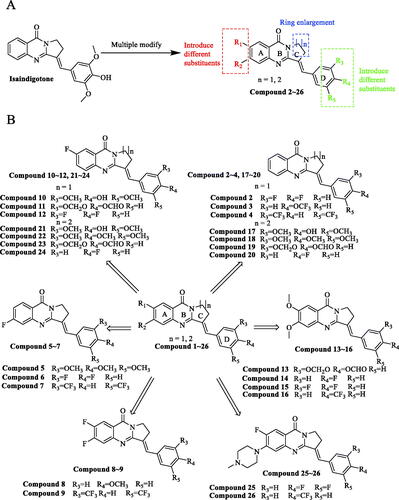
Figure 1. Isaindigotone and its derivatives. (A) General design strategy of the title compounds. (B) Chemical structures of Isaindigotone derivatives.
Scheme 1. Synthesis of isaindigotone derivatives. Reagents and conditions: (A) pyrrolidin-2-one or 2-piperidone, POCl3, toluene, reflux; (B) 1-methylpiperazine, DMF, K2CO3, reflux; (C) different substituted benzaldehydes, AcOH, AcONa, reflux.
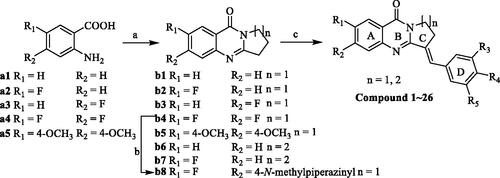
Figure 2. AGS and GES-1 cell viability after Compound 6 and cisplatin treatment. (A, B) Concentration and time dependent anti-proliferation effects of Compound 6 on AGS cells. (C, D) After 48 h treatment, the cytotoxic effects of the most active compounds, Isaindigotone and cisplatin on GES-1 cells. Values are shown as the means ± standard, n = 3. * p< 0.05, **p< 0.01, *** p< 0.001 compared with Pt.
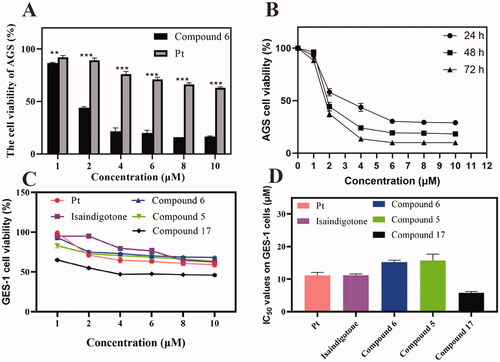
Table 1. Anti-proliferative activities (IC50, μM) of the derivatives for 48 h.
Table 2. The structure of isaindigotone derivatives.
Figure 3. Cell cycle and apoptosis assays were tested with flow cytometry. (A, C) AGS cells were treated with Compound 6 (0.0, 2.0, 3.0, 4.0, and 5.0 μM) for 24 h, and analysed by flowed cytometry (B, D) Analysis of cell apoptosis induced by Compound 6 using Annexin V/PI assay. * p< 0.05, **p< 0.01, *** p< 0.001 compared with negative control.
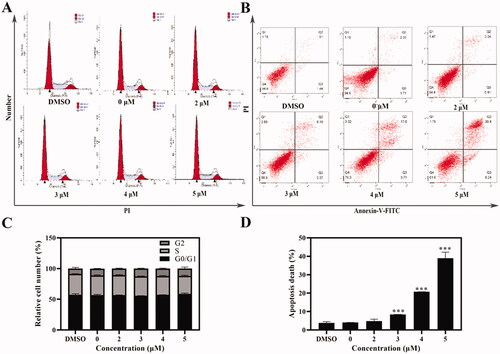
Figure 4. Compound 6 induced apoptosis and mitochondrial depolarisation in AGS cells. (A) AGS cells were treated with Compound 6 (0.0, 2.0, 3.0, 4.0, and 5.0 μM) for 48 h and stained with Hoechst 33258. DMSO was used as negative control. (A) AGS cells were treated with Compound 6 (0.0, 2.0, 3.0, 4.0, and 5.0 μM), CCCP (5.0 μM) and DMSO for 48 h and MMP was determined using the JC-10 kit.
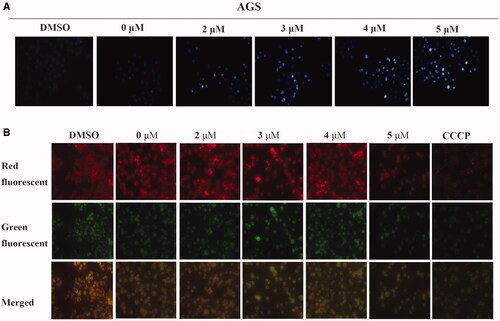
Figure 5. The result of molecular docking of Compound 6 and ipatasertib with AKT1 (PDB: 6HHF). (A, B) The binding conformation of ipatasertib in the active site of AKT1. (C, D) The binding conformation of Compound 6 in the active site of AKT1.
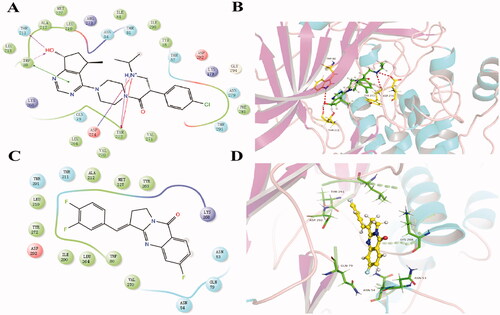
Figure 6. The effect of Compound 6 and the expression of mitochondrial-dependent pathway related proteins and PI3K/AKT/mTOR signal pathway related proteins and AKT1 inhibition effects of Compound 6 and positive control ipatasertib. (A, B) protein levels of PI3K, AKT, p-AKT, mTOR, Bcl-2, Bax, and cleaved-caspase 3. (C, D) Statistical analysis. (E) Inhibition effects of Compound 6. (F) Inhibition effects of Ipatasertib. * p< 0.05, **p< 0.01, *** p< 0.001 compared with control.
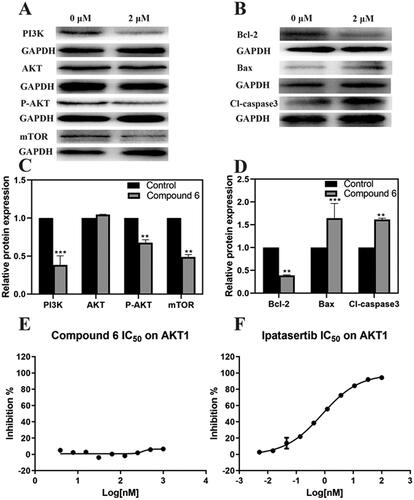
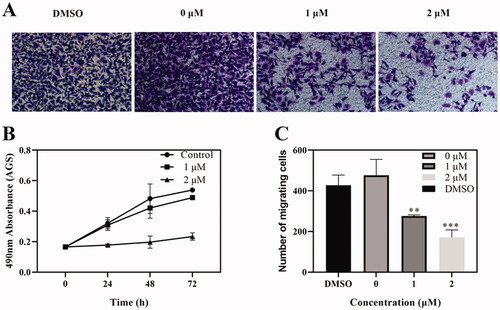
Figure 7. Effects of Compound 6 on tumour cell migration. (A) Transwell assay showed that cell migration of AGS were inhibited by Compound 6. (B) MTT assay showed that Compound 6 (0.0, 1.0, and 2.0 μM) inhibited AGS cell proliferation at 24, 48, and 72 h. (C) Statistic analysis. Values are shown as the means ± standard, n = 3. * p< 0.05, **p< 0.01, *** p< 0.001 compared with negative control (DMSO).