Figures & data
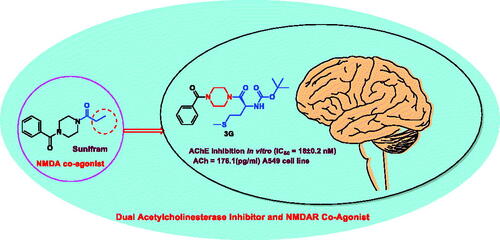
Figure 1. Examples of AChEI drugs.
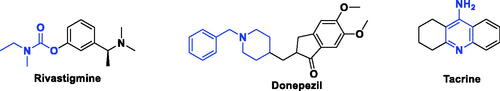
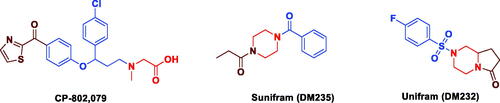
Figure 2. Reported cognitive enhancers.
Scheme 1. Reported method for Sunifiram synthesis.
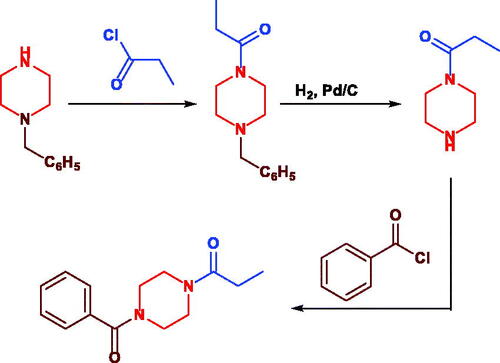
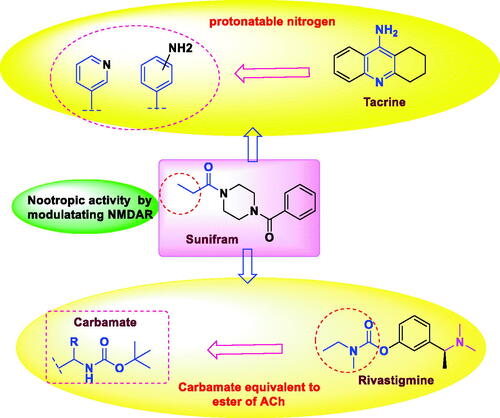
Figure 3. The rational of novel NMDA receptor modulators and acetylcholinesterase (AChE) inhibitors.
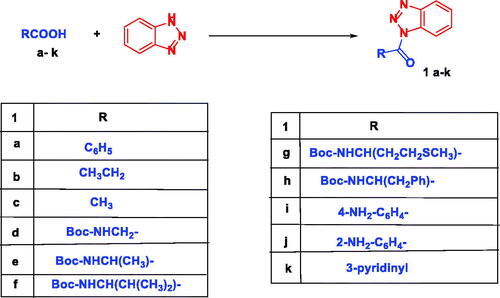
Scheme 2. Synthesis of N-acylbenzotriazoles 1a-k. Reagent condition: DCC (1.4 eq) in CH2Cl2, rt, 12 h.
Scheme 3. Synthesis of Sunifiram (3a) and Sunifiram analogues (3b-j). Reagent condition: a) n-butanol, rt, 3h, b) n-butanol, 60 °C, 12 h. For R, see and “Experimental” section.
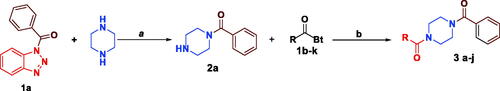
Figure 4. Cytotoxicity IC50 of compounds 3c-j and 3a (Sunifiram) on A549 cell line.
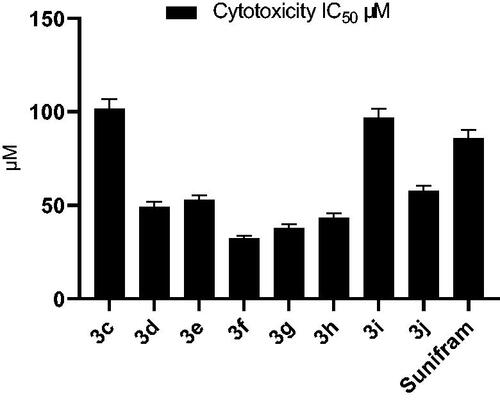
Table 1. Yield % and cytotoxicity IC50 of compounds 3c-j and Sunifiram 3a on A549 cell line.
Figure 5. Acetylcholine released in response to compounds 3c-j and Sunifiram (3a) from A549 cells.
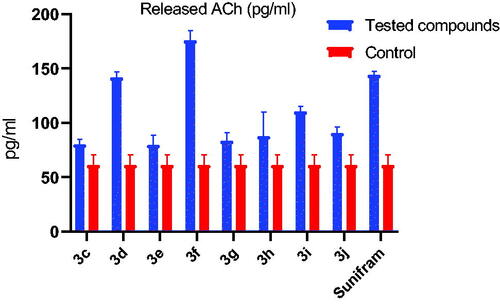
Table 2. Acetylcholine released in response to compounds 3c-j and 3a from A549 cells.
Figure 6. SAR of novel AChEI.
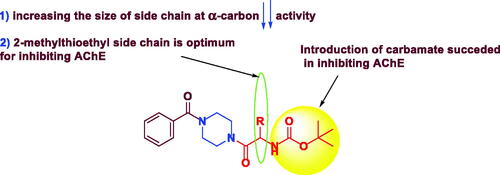
Table 3. Anticholinesterase activity of synthesised Sunifiram analogues.
Figure 7. AChE level on rat brain after i.p. administration of 3f and tacrine.
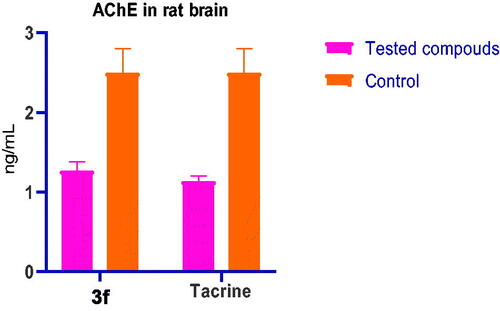
Table 4. AChE level on rat brain after i.p. administration of 3f and tacrine.
Table 5. Molecular docking scores of Sunifiram and synthesised analogues.
Table 6. Predicted physicochemical properties of synthesised Sunifiram analogues.
Figure 8. Comparative RMSD plots of C-a atoms of Sunifiram (black), 3i (red), and the unbound Apo (green). B) Comparative RMSF plots of individual residues of Sunifiram (black), 3i (red), and the unbound Apo (green) conformations over the simulation period. C) Comparative RoG plots of C-a atoms of Sunifiram (black), 3i (red), and the unbound Apo (green). D) 3D structural superposition of Sunifiram (black), 3i (red), and the unbound Apo (green) to show structural flexibility.
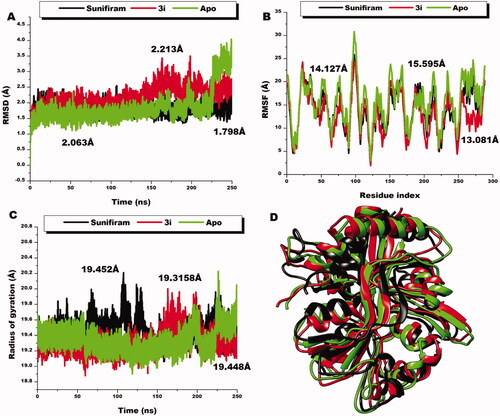
Figure 9. Comparative RMSD plots of C-a atoms of 3i (red), glycine (magenta), and the unbound Apo (green). B) Comparative RMSF plots of individual residues of 3i (red), glycine (magenta), and the unbound Apo (green) conformations over the simulation period. C) Comparative RoG plots of C-a atoms of 3i (red), glycine (magenta) and the unbound Apo (green). D) 3D structural superposition of 3i (red), glycine (magenta) and the unbound Apo (green) to show structural flexibility.
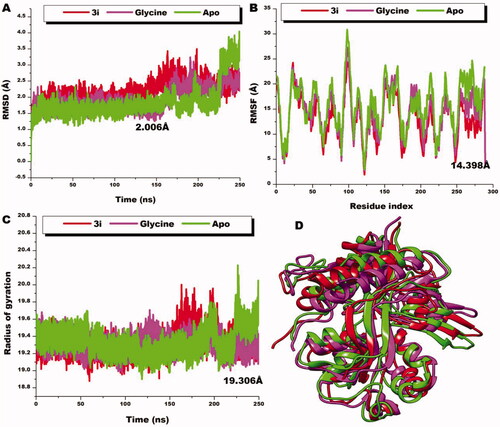
Table 7. MMGBSA- based binding free energy profile of Sunifiram and compound 3i.
Figure 10. Per-residue energy decomposition of glycine binding site residues and their corresponding energy contributions towards the binding and stability of Sunifiram, 3i A) Per-residue energy plots of binding sites residues towards Sunifiram and the 3D representation of intermolecular interactions exhibited by Sunifiram. B) Per-residue energy plots of binding sites residues towards the binding of compound 3i and the 3D representation of intermolecular interactions exhibited by 3i.
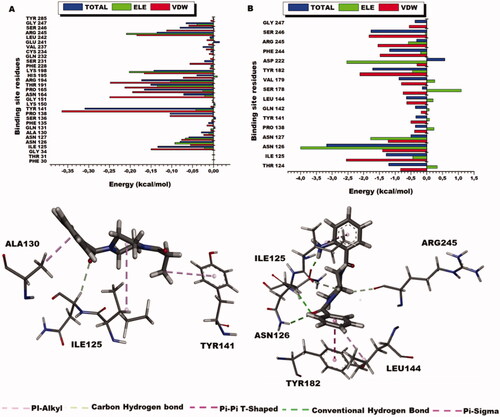
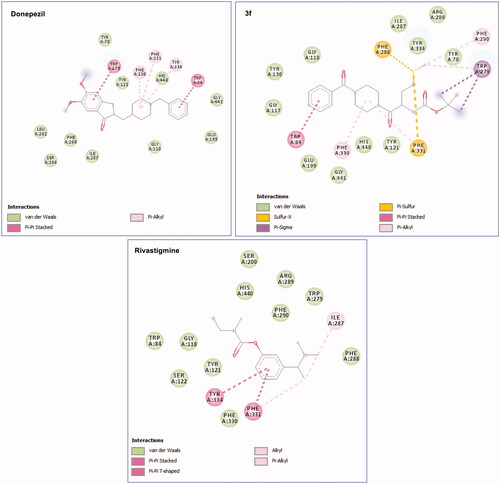
Figure 11. 3D binding of compound 3f in the catalytic and peripheral pocket of AChE.
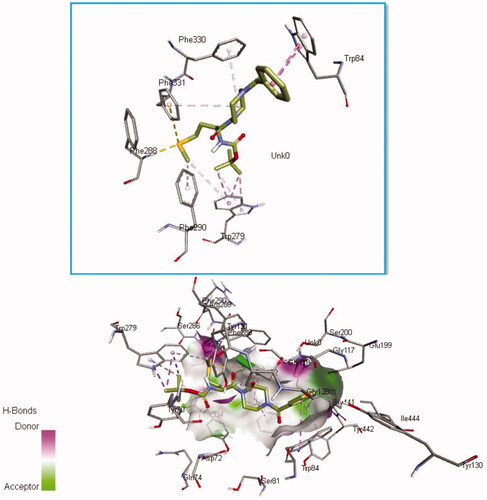
Table 8. Molecular docking scores of Sunifiram analogues towards AChE.
Figure 12. Molecular visualisation of 3f-AChE, donepezil-AChE, and rivastigmine-AChE binding pocket.