Figures & data
Figure 1. Structure and numbering scheme of diosgenin (DSG, 1).
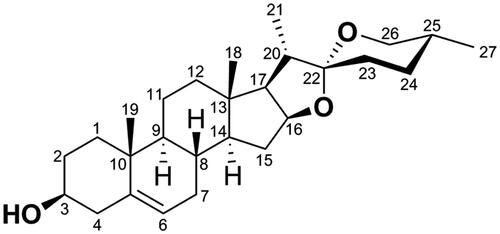
Figure 2. Chemical structures of several examples of natural product and benzoic acid mustard hybrids.
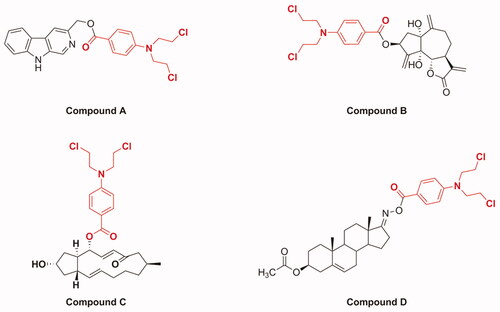
Table 1. Primer sequences for qRT-PCR.
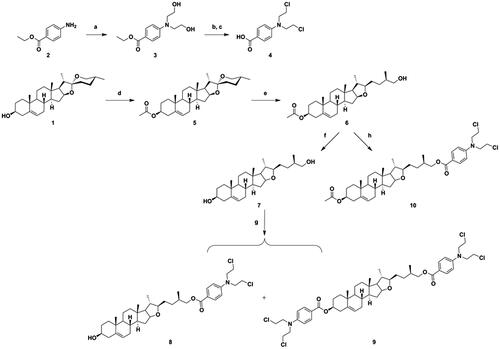
Scheme 1. Synthesis of diosgenin–benzoic acid mustard trihybrids 8−10. Reagents and conditions: (a) ethylene oxide, H2O, CH3COOH, rt, 24 h; (b) POCl3, 50 °C, 0.5 h; (c) 10% HCl, 12 h; (d) Ac2O, dry pyridine, dry CH2Cl2, rt, 6 h; (e) NaBH3CN, AcOH, CH2Cl2, rt, 8 h; (f) KOH, CH3OH, rt, 6 h; (g) (h) Benzoic acid mustard, EDCI, DMAP, CH2Cl2, rt, 24 h.
Scheme 2. Synthesis of diosgenin–benzoic acid mustard hybrids 14a−14f and 15a−15f. Reagents and conditions: (a) Jones reagent, THF/acetone (1/1), rt, 3 h; (b) N-Boc-protected amines, TBTU, DIPEA, CH2Cl2, rt, 8 h; (c) CF3COOH, CH2Cl2, rt, 4 h; (d) Benzoic acid mustard, DMAP, EDCI, CH2Cl2, rt, 24 h; (e) NaOH, CH3OH/THF (1/1.5), rt, 6 h.
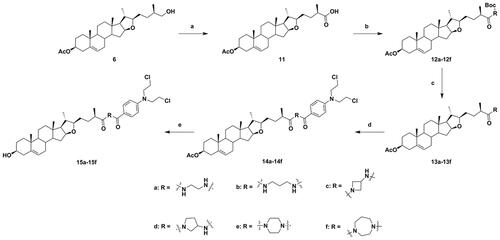
Table 2. Cytotoxic activities of target hybrids 8– 10, 14a–14f and 15a–15f in different cell lines.
Figure 3. Analysis of the effects of 14f on the cell cycle in HepG2 cells. HepG2 cells were treated with indicated concentrations (5, 10, and 20 μM) of 14f for 24 h, harvested, stained with PI, and assessed using a flow cytometer.
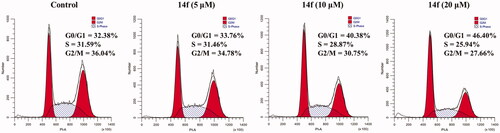
Figure 4. Effect of 14f on the levels of cell cycle-related genes and proteins in HepG2 cells. GAPDH served as the loading control. (A) Relative mRNA level. (B) The expression of proteins was detected using Western blot. Values have been represented as mean ± SD (n = 3). *p<0.05; **p<0.01; ***p<0.001 versus control group.
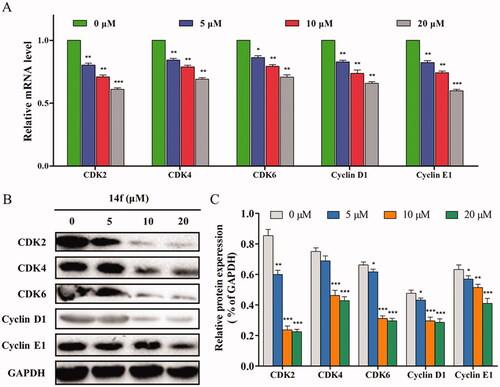
Figure 5. Fluorescence microscopy images of HepG2 cells stained using Hoechst 33342/PI. HepG2 cells were treated with different concentrations (5, 10, and 20 μM) of 14f for 48 h.
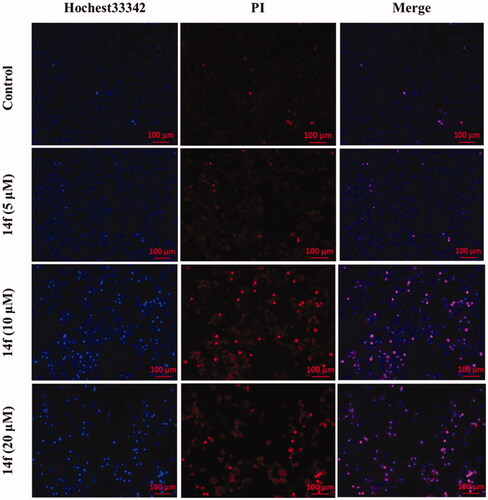
Figure 6. Flow cytometry analysis of 14f-induced apoptosis in HepG2, as assessed using Annexin V-FITC/PI assay. The percent of apoptotic cells is indicated on the right. Values have been represented as mean ± SD (n = 3). **p<0.01; ***p<0.001 versus control group.
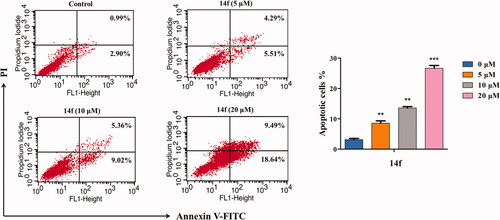
Figure 7. 14f induced the collapse of mitochondrial membrane potential (ΔΨm) in HepG2 cells. After treatment with 14f for 48 h, the cells stained with JC-1 were determined by means of flow cytometric analysis. Values have been represented as mean ± SD (n = 3). **p<0.01; ***p<0.001 versus control group.
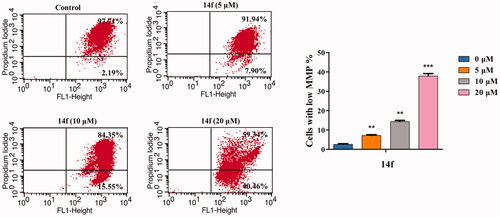
Figure 8. 14f activated the mitochondrial pathway, to regulate the apoptosis of HepG2 cells. (A) Relative mRNA level. (B) The activities of caspase 9 and caspase 3 were detected using ELISA. (C) The relative protein expression levels were detected using western blot analyses. (D) Quantitative analysis of the protein expression data mentioned in (C). Values have been represented as mean ± SD (n = 3). **p<0.01; ***p<0.001 versus control group.
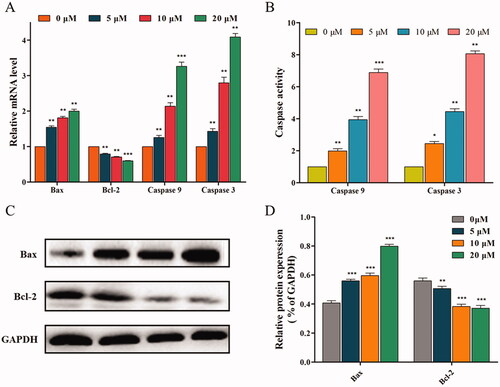
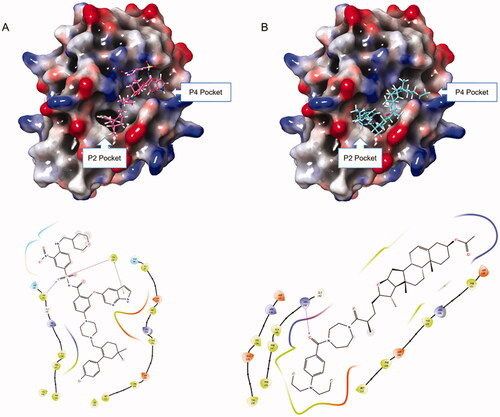
Figure 9. (A) Binding mode of ABT-199 to Bcl-2 protein; (B) Binding mode of 14f to Bcl-2 protein.