
Figures & data
Figure 1. High-throughput screening. (A) The fluorescent-based DNA polymerase assay used to screen the compound libraries. The DNA template strand is a hairpin loop with a primer annealed to the loop. The 3’ end of the primer is 11 bases away from the 6 bp duplex. Strand displacement activity of the DNA polymerase separates the Cy3 dye from the Black hole quencher leading to an increase in fluorescent signal. (B) The high-throughput assay workflow. The DNA polymerase is incubated with 10 mM compound for 10 min prior to addition of the hairpin substrate. The reaction is quenched at 3 different time points and the fluorescent signal is measured and % inhibition is determined using the provided equation.
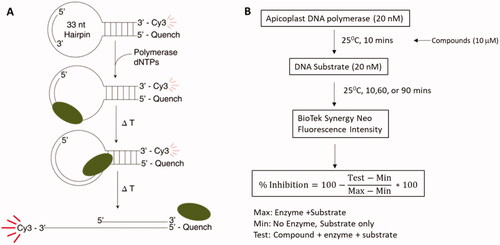
Figure 2. A scattergram of the large-scale screen of 11 compound libraries (listed at right). The overall hit rate for the screen was 0.59%.
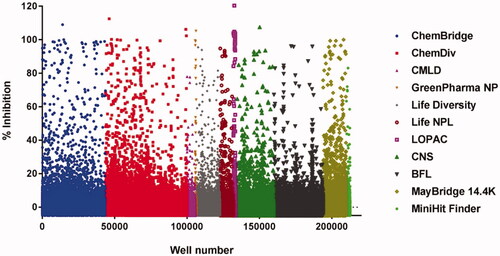
Table 1. Results from high-throughput screening to identify inhibitors of P. falciparum apicoplast DNA polymerase.
Figure 3. A plot of FragFp similarity for the non-toxic, specific apPOL inhibitors (102 compounds). Chemical similarity was calculated using the DataWarriorCitation22 software package. The core structure for the two largest clusters are given. Each compound is labelled with a number corresponding to the data in Supplemental file 1. The markers are coloured according to IC50 values and the number of Lipinski violations are indicated by marker shape.
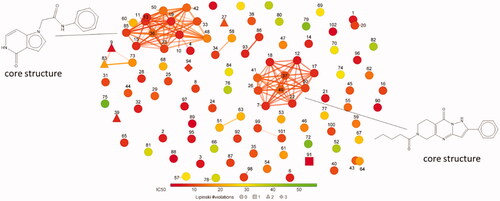
Figure 4. Potential as lead compounds. A plot of the synthetic accessibility versus leadlikeness violations for the non-toxic, specific apPOL inhibitors is shown. Each compound is labelled with a number corresponding to the data in Supplemental file 1. The markers are coloured according to their IC50 values and the number of Lipinski violations are indicated by marker shape. A description of synthetic accessibility and leadlikeness can be found in the main text.
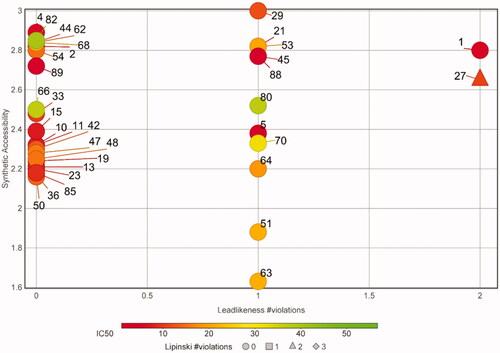
Figure 5. Compounds active against cultured Plasmodium falciparum. A plot of IC50 values versus EC50 values is shown. The markers are coloured according to their Druglinkess values as calculated by the DataWarriorCitation22 software package. The number of Lipinski violations are indicated by marker shape.
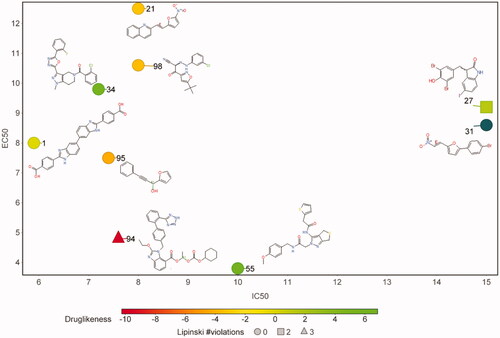
Table 2. Inhibition data for compounds found to be active against cultured Plasmodium falciparum.