
Figures & data
Figure 1. Recently published benzamides and benzimidazole-2-carboxamides with great antioxidative potential.
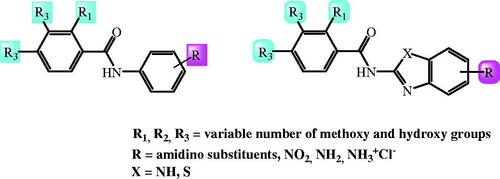
Table 1. IC50 values for 1,1-diphenyl-picrylhydrazyl (DPPH) free radical scavenging and ferricreducing/antioxidant power (FRAP) activities.
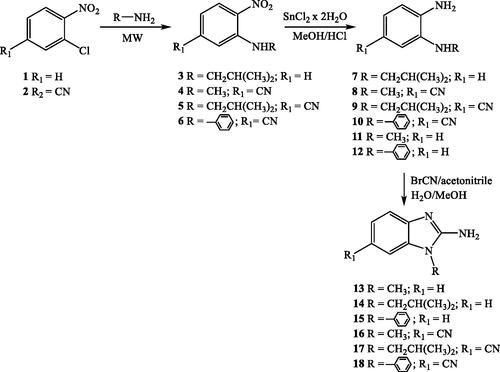
Scheme 1. Synthesis of N-substituted 2-aminobenzimidazoles 13–18.
Scheme 2. Synthesis of N-substituted benzimidazole-2-carboxamides 27–54.
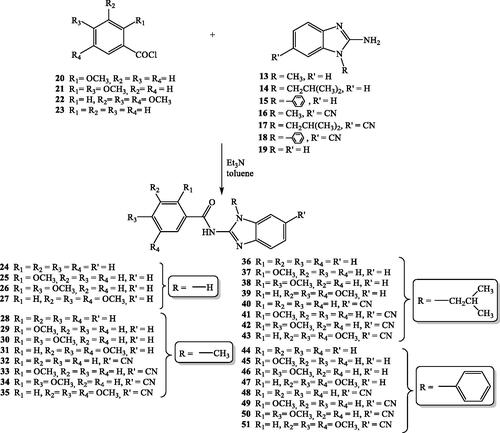
Figure 2. The most active potential antioxidant 34 chosen for further structure optimisation.
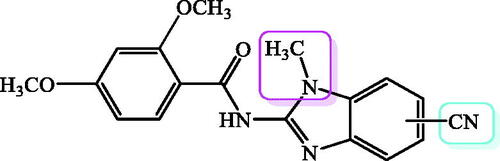
Figure 3. The most active derivative 40 chosen for further structure optimisation.
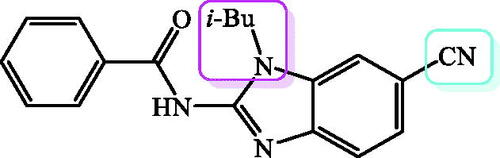
Table 2. Antiproliferative activity of tested compounds
Figure 4. Antioxidative activity of selected compounds in cells. HCT 116 cells were treated with the combination of tert-Butyl hydroperoxide (TBHP, 200 µM) and N-Acetyl-l-cysteine (NAC, 10 mM) or tested compounds 34 and 40 (10 µM) for 1 h. The level of reactive oxygen species (ROS) was measured with fluorescent dye 2′,7′-dichlorodihydrofluorescein diacetate (DCFH-DA) using fluorimeter. Treatment with 200 µM TBHP alone was used as a control for ROS induction. Data presented here are the results of two independent measurements, done in triplicates. One-way ANOVA with Tukey’s post hoc test was used for statistical analysis, *p < .05, **p < .01, ***p < .001.
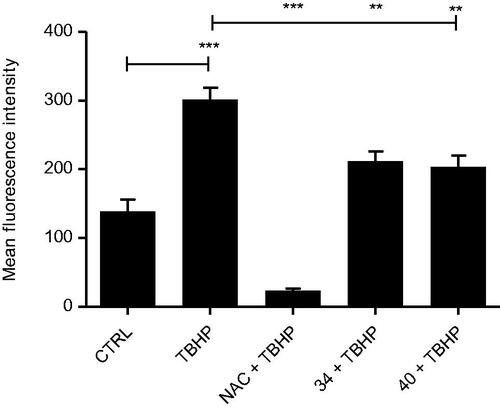
Figure 5. Nrf2 protein levels in the cytoplasmic and the nuclear fraction of HCT116 cells, assessed by Western blot analysis. HCT116 cells were treated with the 4 mM hydrogen peroxide as a positive control for ROS induction and with compounds 34 and 40 (50 µM and 5 µM, respectively) for 1 h. Representative western blots of Nrf2 in cytoplasm and the nuclear fraction are presented. Histone H3 and β-actin were employed as loading controls for nuclear and cytoplasmic fraction; respectively. Results are presented as mean ± SD; number of samples was n = 3.
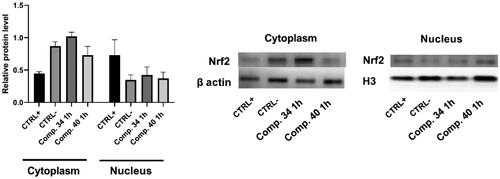
Figure 6. Products of the descriptor’s average value calculated for the dataset used to derive model and the associated PLS coefficient of 3D-QSAR model for: (A) model 1 and (B) model 2.
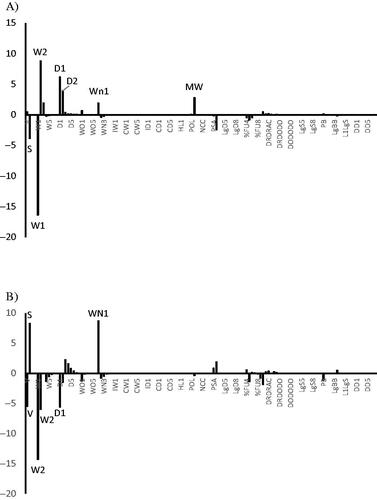
Table 3. Statistical properties of 3D-QSAR models.